

In previous articles we have talked about the importance of a good sow replacement, and we have explained methods to calculate an adequate sow replacement rate. In this article we are going to show an example of a bad replacement policy and its consequences along time on the productivity of the farm.
In the first place we show the productivity (total piglets born, born alive and weaned) according to the parturition number in the farm, with data from the last 4 years.
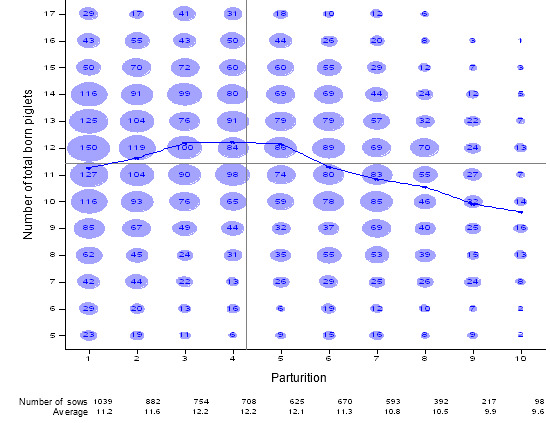
Graph 1.- Number of total born piglets according to the parturition number; period January 2006-December 2009
Graphs according to the parturition number
Farm XX
Completed on May 24th 2010
6,012 sows that farrowed between April 1st 2006 and March 31st 2010 (Parturition average: 4.3)
Graph of the parturition number vs. the number total of born piglets (Average number of total born piglets: 11.4)

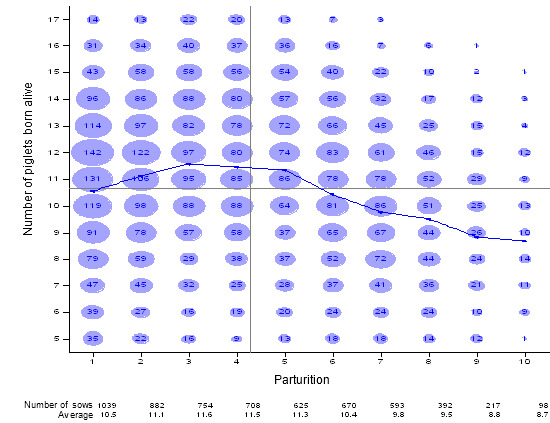
Graph 2.- Number of piglets born alive per parturition number; period: January 2006-December 2009
Graphs according to the parturition number
Farm XX
Completed on May 24th 2010
6,012 sows that farrowed between April 1st 2006 and March 31st 2010 (Average parturition number: 4.3)
Graph of the parturition number vs. the number of piglets born alive (Average number of piglets born alive:10.7)
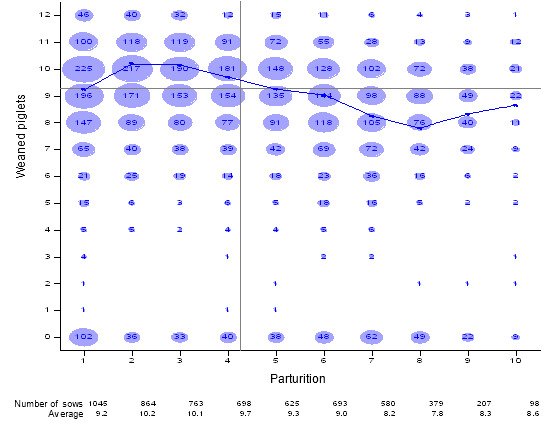
Graph 3.- Piglets weaned/sow according to the parturition number; period: January 206-December 2009
Graphs according to the parturition number
Farm XX
Completed on May 24th 2010
5,983 sows totally weaned between April 1st 2006 and March 31st 2010 (Average parturition number: 4.2)
Graph of the parturition number vs. the number of weaned piglets (Average number of weaned piglets: 9.3)
As it can be seen, in this farm, as in the majority, the most productive parturitions are those from the 2nd to the 5th, and those of the first parturition sows and especially of the old sows are the less productive ones.
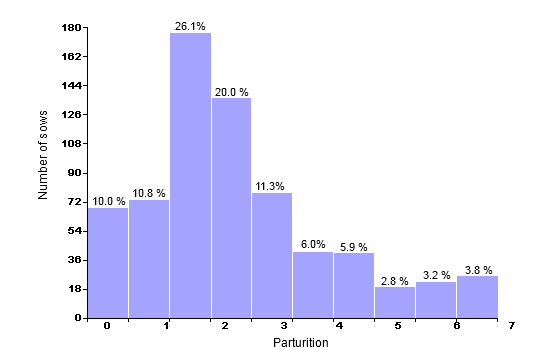
The starting situation is the census structure on December 31st 2006, after an expansion process during year 2006.
Graph 4.- Census structure on December 31st 2006 (668 productive sows; average: 3.08 parturitions)
Farm structure
Farm XX
Completed on May 24th 2010
668 sows in the farm on April 5th 2007 (Average parturition: 3.16)
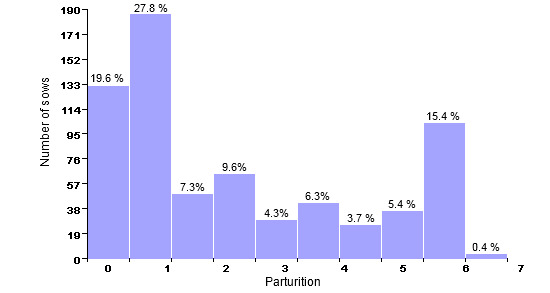
The census structure is that typical of a farm that has expanded its census, with a high % of sows in their first parturitions (although there is a high number of old sows as a consequence of a bad previous replacement policy).
For this number of productive sows, and calculating, roughly, a replacement rate of a 55%, the number of gilts entered every year should be 368. Nevertheless, only 290 gilts are entered (replacement rate = 39%). This causes that after a year has gone by (December 2007), the census structure is as follows:
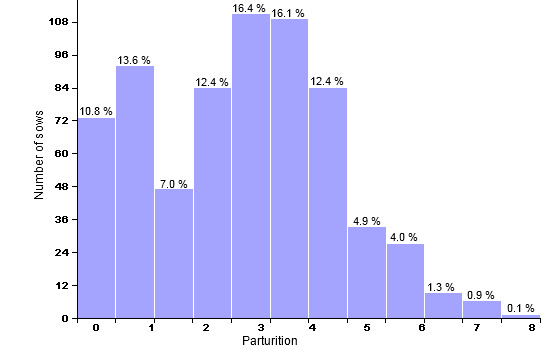
Graph 5.- Census structure on December 31st 2007 (679 productive sows; average: 3.16 parturitions)
Farm structure
Farm XX
Completed on May 24th 2010
679 sows in the farm on April 5th 2008 (Average parturition: 3.16)
If we take this "picture", this would be the most productive census structure: few replacement sows have been entered in the farm, so the expenses with respect to this item have not been high, and also, the majority of the sows in the farm are in the most productive parturitions. Nevertheless, let us see what happens with time.
During year 2008 the replacement of sows is still low (28%), and this gives, as a result, the following census structure the following year (December 2008).
Graph 6.- Census structure on December 31st 2008 (676 productive sows; average: 3.74 parturitions).
Farm structure
Farm XX
Completed on May 24th 2010
676 sows in the farm on April 5th 2009 (Average parturition: 3.74)
The structure is still off-balanced, and in this case the average age in the farm does suffer a considerable increase (from 3.16 to 3.74 parturitions). We start to have more sows in the less productive parturitions (from the 5th one onwards).
Finally, during the last year (2009), the replacement rate is a 31%, and gives as a result, at the end of the year, the following structure.
Graph 7.- Census structure on December 2009 (673 productive sows; average: 4.28 parturitions)
Farm structure
farm XX
Completed on May 24th 2010
673 sows in the farm on April 5th 2010 (Average parturition: 4.28)
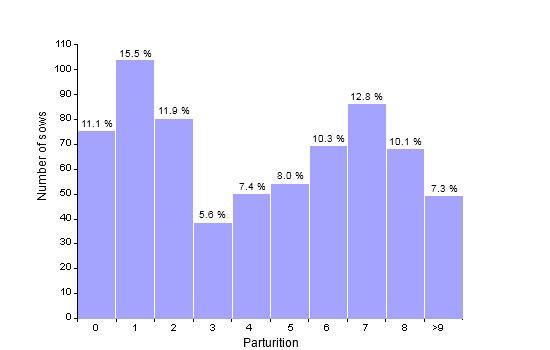
The final result of all this process is a census with a "U" shape, and this is the reverse situation with respect to that found 2 years before: there is a clear deficit of sows in the most productive parturitions and an excess of not very productive sows, especially old sows, and this clearly has a negative influence on the global productivity of the farm.
Also, in order to solve this problem the only way is to increase the replacement until a minimum value of a 55% (and even higher, if we want to speed up the process), and eliminate the old sows gradually. But this process will need between a year and a half and two years until a stabilized census is reached, and during this period the productivity will still suffer (especially if we bear in mind that the group of the older sows will be reduced gradually, but as an average they will be older and less productive each time).
So, and although the decrease in the entrance of replacement gilts can imply advantages in the short term, in the medium-long term the negative impact on the productivity will always be higher, so for a farm it is fundamental to maintain an adequate (with respect to the percentage) and constant replacement rate throughout time.
