Regular returns to estrus occur 18 - 24 days and 38 - 44 days post-service. A sow has a regular return (maintaining the normal duration of an estrous cycle: 18-24 days or its multiples) when fertilization of the eggs has failed or when all fertilized embryos have been lost within the first half of the estrous cycle (<10-12 days).
Under normal conditions these should make up a very small percentage of the matings, < 5%.

Causes related to the semen dose:
1. Semen dose quality: This will affect fertility and prolificacy. Different factors influence the quality of the seminal doses, but perhaps the most important are how old the doses are or those factors affecting their storage, such as the quality of the water, extender, storage conditions (temperature variations), etc.
Table 1. Influence of various aspects of semen quality on AI results
| Frequency | Farrowing rate (%) | BA | |
|---|---|---|---|
| Age of semen dose | 14/51 | -18 | -1 |
| Storage | 8/51 | -7 | -0.7 |
| Water quality | 8/51 | -7 | -0.6 |
| Extender quality | 8/51 | -17 | -1.2 |
| Sub-optimal dilution | 5/51 | -10 | -1 |
| Morphology | 5/51 | -11 | -1 |
| Subfertile boars | 3/51 | -51 | -5.8 |
Flowers, B. 1996. Successful AI programs. Proc. Swine. Reprod. Symp. Am. Soc. Therio, pp 15-25.
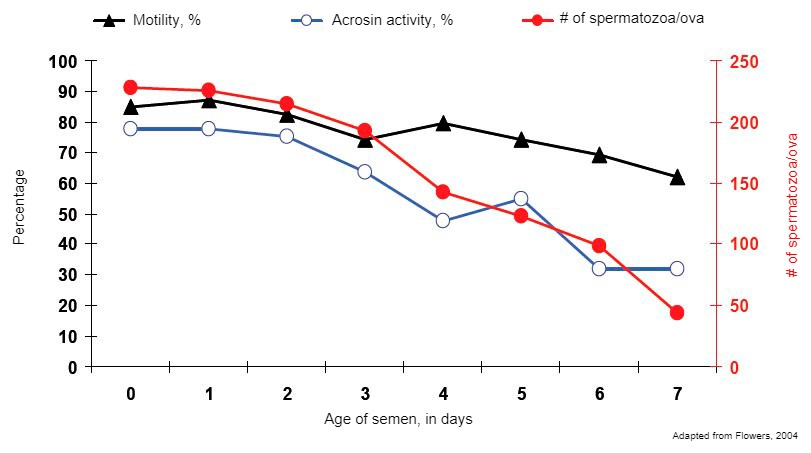
1.1. Age of the semen dose
The age of the semen doses will affect sperm quality, reducing their viability and fertilizing capacity.
1.2. Storage
Clearly, poor storage will cause the sperm to age more quickly and thus accelerate the effects shown in the graph above. In storage, factors such as the quality of the water, the extender, or the type of plastic used have an influence.
Table 2. Fertility depending on storage, using a short-term extender (BTS).
| Hours in storage | Fertility (%) | Total born | Born alive |
|---|---|---|---|
| 4-14 | 67.7a | 11.96a | 10.94a |
| 28-38 | 69.8a | 11.73b | 10.73b |
| 52-62 | 64.6b | 11.61b | 10.64b |
a,b Distinct letters in the same column indicate a significant difference with p<0.05. Source: Hofmo, 1991
When using a long-term extender, one can begin to observe differences from the 6th day onward (see table).
Table 3. Fertility and litter size for AI using two different extenders. J. Gadea. 2003
| Days | A | B | ||||
|---|---|---|---|---|---|---|
| Nº | Fertility (%) | Total born | Nº | Fertility (%) | Total born | |
| 2-3 | 170 | 85.9 | 10.3 | 172 | 86.1 | 10.2 |
| 3-4 | 164 | 86.6 | 9.2 | 151 | 84.1 | 10.0 |
| 4-5 | 188 | 85.1 | 9.0* | 183 | 86.3 | 10.4* |
| 5-6 | 201 | 78.6* | 9.4 | 202 | 85.6* | 9.7 |
*p<0.01. Source: Kuster and Althouse (1999)
Seminal dose packaging systems are automated in most commercial insemination centers, using different container systems. Plastic bags allow the diluted semen to be brought to storage temperature more quickly than the tubes. However, the type of plastic used also plays a role. It has been proven that plastics including cyclic lactone and bisphenol A diglycidyl ether (BADGE) among their components negatively affect sow fertility, but interestingly they do not affect sperm motility values.
1.3. Sub-optimal dilution
Sub-optimal dilutions are perhaps one of the most common problems. With the implementation of post-cervical insemination and the reduction in volumes used, sperm concentrations are more critical than ever. It is recommended that sperm concentrations of at least 2.5 x 10⁹/ 80 ml be maintained for conventional doses, or 1.5 x 10⁹/ 50-60 ml in the case of post-cervical doses. Lower concentrations will mainly affect prolificacy, but if concentration gets too low, it will also affect fertility.
1.4. Morphology
Numerous studies show that adequate spermatozoa motility and morphology checkings are related to their fertilizing capacity. Therefore, in case of reduced quality, it would be good to increase concentrations to compensate, and also reduce storage times.
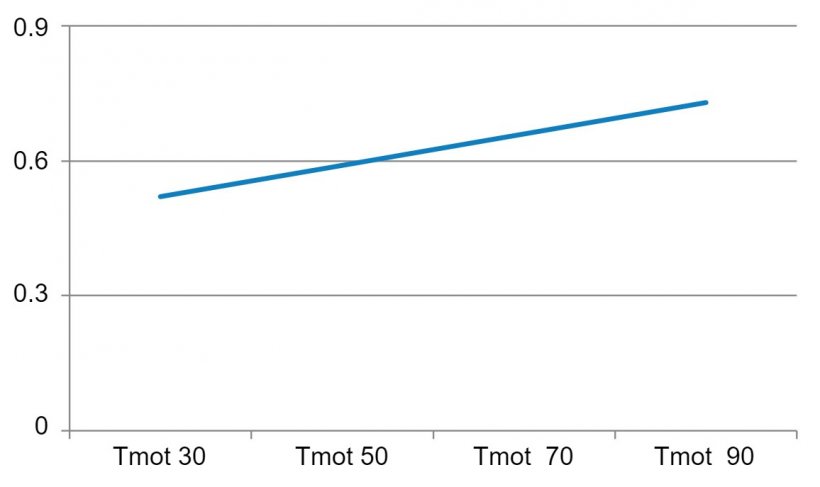
Figure 2. Total motility (Tmot): the percentage of spermatozoa that have head movement. Sungwon Park, 2013
1.5. 5. Subfertile boars
Not all boars have the same fertilizing capacity. Genetic differences between them, their age, factors such as nutrition, temperature, vaccinations, or collection frequency are some of the factors that can affect the fertilizing quality of their semen.
Table 4. Effect of boar age on seminal dose fertility
| Age of group | N1 | N2 | Farrowing rate (%) | BA (average ± SEM) |
|---|---|---|---|---|
| Young boars (7-10 months, n=5) | 11 | 55 | 65.00 (117/180)a | 11.62 ± 0.51a |
| Mature boars (18-33 months, n=7) | 25 | 175 | 87.24 (1259/1443)b | 10.53 ± 0.25a |
| Old boars (51-61 months, n=5) | 14 | 70 | 84.74 (372/439)b | 11.13 ± 0.23a |
| TOTAL | 11-25 | 300 | 84.77 (1747/2062) | 10.87 ± 0.23 |
The values with different letters within each column are significantly different (P<0.001; x2 = 29.99 - 61.42). The effect of the boar on the farrowing rate is significant (P < 0.005). N1 and N2 denote the number of ejaculates used per boar and per group, respectively. Tsakmakidis, I.A. et al. 2012.
2. Quality of the insemination process
The quality of the insemination process will also have an impact on the percentage of returns. Poor heat detection, which can lead to incorrect timing for insemination, or an insufficient number of doses, can have a major impact on the results.
Table 5. Influence of various aspects on AI results. Flowers, B. 1996
| Frequency | Farrowing rate (%) | BA | |
|---|---|---|---|
| Poor heat detection | 15/50 | -15 | -0.6 |
| Low number of services | 10/50 | -8 | -0.3 |
| Incorrect timing of AI | 8/50 | -7 | -0.4 |
| Poor AI technique | 5/50 | -8 | -0.5 |
3. Post-insemination management
Stress, in all its forms, can be one of the causes for sows having a regular return to estrus. There are two particularly critical times:
- The first 30 minutes post-insemination. Stress during this time will block the oxytocin responsible for sperm transport and may affect the proper fertilization of the ova.
- The first 10-12 days post-service (may be heat stress). During this time stress can easily affect the proper implantation of the embryos, leading to the loss of gestation.
Table 6. Influence of post-IA management. Flowers, B. 1996
| Frequency | Farrowing rate (%) | Born alive | |
|---|---|---|---|
| Mixing sows | 8//19 | -7 | -1.8 |
| Moving sows | 7/19 | -10 | -1.2 |
See the sow-related causes for regular returns ![]()
Use the button above or the flowchart to continue troubleshooting the returns, or to access other parts of the tool.