In the last decades, several tools have been created to be implemented in the swine respiratory complex diseases (SRCD) control programmes. One of them is the lung score assessment, a method that allows to know the prevalence of animals affected by pneumonia, as well as the extension of the lung lesions.
The main goal of the lung score is to establish the health status of a pig population, which is reflected in an index resulting from a series of calculations obtained with the results of the assessed lungs. It is very important that this assessment is performed periodically and at fixed times, because the results shown along time give a better idea of the situation faced by the pig population, so better decisions can be made when facing health challenges. Likewise, it is urgent that the results are accompanied by other kinds of tests, such as serological profiles and anatomopathological exams, so we can confirm that what has been seen at the abattoir is really happening in field conditions.

Sample size and evaluation conditions
The size of the sample will depend on the size of the population to be studied. For instance, in fattening pigs populations with 15,000-40,000 heads, an appropriate sample size would be 100-200.
When carrying out the assessment at the abattoir, it is important to ensure a suitable place for examining and palpating each lung, and an optimal lighting.
Lung scoring operational procedure
The lung is anatomically divided in 7 lobes: right apical (RA), left apical (LA), right cardiac (RC), left cardiac (LC), right diaphragmatic (RD), left diaphragmatic (LD) and accessory (A) (see Figure 1).
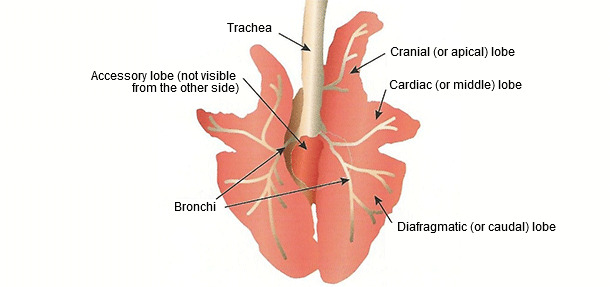
Figure 1. Schematic drawing of the pig lungs (From Leneveu et al., 2009).
The lung lobes have a different size and shape, and each of them has a specific involvement in relation to the weight of the lungs (see Table 1).
Table 1. Percentage involvement of each lobe with respect to the total weight of the lungs (adapted from Sobestiansky and Barcellos, 2007)
| Lung lobe | Percentage of lung weight (%) |
| Right apical (RA) | 11 |
| Right cardiac (RC) | 11 |
| Right diaphragmatic (RD) | 34 |
| Left apical (LA) | 6 |
| Left cardiac (LC) | 6 |
| Left diaphragmatic (LD) | 27 |
| Accessory | 5 |
During the lung assessment, it is advisable to divide each lobe in four equal parts to facilitate the recording of the affectation of each lobe (see Figure 2).
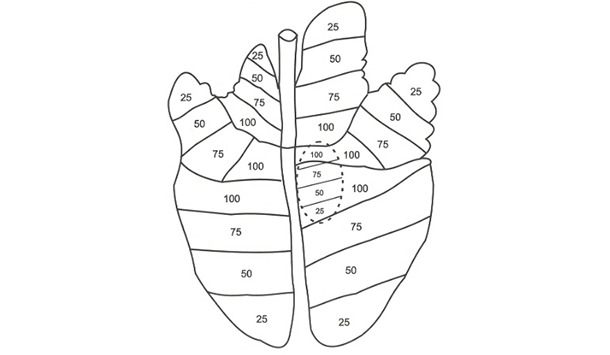
Figure 2. Imaginary division of the lung lobes in four equal parts (adapted from Sobestiansky and Barcellos, 2007).
At the abattoir each lobe is inspected, and its lesion percentage is established. The assessment is carried out with a careful palpation of the whole of the lungs in search of hepatization ('hardened') areas, that belong to pneumonia lesions, and we record the percentage of involvement of each lobe on a card to correlate this with the weight and obtain the pneumonia lesion percentage (see Table 2). Also, any other kind of lesion seen (such as pleurisy, abscesses, adhesions and parenchyma necrosis) is recorded.
Table 2. Example table that includes the recording of the percentage of the pneumonia area of each lung lobe, the total pneumonia area and related lesions.
| Lung lobes score | Remarks | |||||||||||||||
| P. | RA | RC | RD | LA | LC | LD | A | Total area % | Related lesions | |||||||
| 1 | 25% | 35% | 25% | 0% | 2% | 10% | 2% | 18.02 | Pleurisy | |||||||
| PA* | 2.75 | 3.85 | 8.5 | 0 | 0.12 | 2.7 | 0.1 | |||||||||
| 2 | 35% | 40% | 10% | 12% | 20% | 10% | 50% | 18.77 | Pleuropneumonia | |||||||
| PA | 3.85 | 4.4 | 3.4 | 0.72 | 1.2 | 2.7 | 2.5 | |||||||||
| 3 | ||||||||||||||||
| PA | ||||||||||||||||
PA* = Pneumonia area
Prevalence of pneumonia
Based on what has been recorded on the lung assessment card we calculate the prevalence of pneumonia and of the other lesions found. The formula for obtaining the prevalence of pneumonia is as follows:
| Lungs with pneumonia | ||
| Prevalence of pneumonia = | ———————————————— | X 100 |
| Total lungs assessed |
Index of pneumonia
The index of pneumonia (IP) is a categorical value obtained to assign the pneumonia state of the population. To determine this value, the frequency of the pigs in each category seen in Table 3 must be recorded.
Table 3. Categories according to the lung lesion percentage.
| Category | Lung lesion percentage |
| 0 | 0 |
| 1 | 0.1 to 11 |
| 2 | 11.1 to 21 |
| 3 | 21.1 to 31 |
| 4 | 31.1 to 41 |
| 5 | 41.1 to 51 |
| 6 | 51.1 to 100 |
Once the frequency of pigs per category has been recorded, we multiply the frequency by the category number, and we then add the results. To better understand this calculation we must look at Table 4.
Table 4. Multiplication of the frequency of pigs by the category number.
| Category | ||||||||
| 0 | 1 | 2 | 3 | 4 | 5 | 6 | Total | |
| Number of pigs | 95 | 3 | 5 | 6 | 3 | 0 | 0 | 112 |
| Multiplication | 95x0 | 3x1 | 2x5 | 3x6 | 4x3 | 5x0 | 6x0 | |
| Index per category | 0 | 3 | 10 | 18 | 12 | 0 | 0 | 43 |
The example in Table 4 shows the calculation in a batch of 112 pigs. After this procedure has been carried out we make the last calculation to obtain the IP, which we show below:
| Total index per category | 43 | |||
| Index of pneumonia = | ——————————————— | = | ——— | 0,383 |
| Total lungs assessed | 112 |
Once the IP has been obtained, the interpretation of the result is established according to the following table.
Table 5. Interpretation of the index of pneumonia (IP)
| Index of pneumonia | Interpretation |
| 0.1 to 0.55 |
Population with imperceptible pneumonia. |
| 0.56 to 0.89 |
Population where pneumonia is present, but it does not pose a threat. There are risk factors that, if not corrected, may complicate the situation. |
| > 0.9 |
It represents a complicated health situation. Population with a serious pneumonia incidence, which is higher the higher the index is. |
Economic evaluation
Some pig companies add the economic impact that the sample would have with the results obtained. This analysis is useful for seeing how a disease has an impact on the economic management of the company. To calculate this impact, the appraisers base themselves on a study carried out by Straw et al. (1989), who establish that the cost of pneumonias is determined by the lung lesion percentage of the affected animal. According to this, an animal with 10% of lung lesions loses 37.4 g/day of daily weight gain and worsens its feed conversion index by 4.5%.
What do we do in practice?
The lung lesions assessment at the abattoir allows to study in more depth the respiratory diseases of the PRC. It provides very valuable information for the veterinarians that manage the health of a pig population, because it is like a reliable X-ray of the lung health. The interpretation of the results is based on the index of pneumonia (explained above) or on the average lung lesions percentage value. It is very difficult to find populations with 0% of lesions. Nevertheless, we consider acceptable an average lesion percentage that does not exceed 2.5-3%. Higher lesion percentages reveal that the population health control is poor at some point.
The economic evaluation of each assessment allows the producer to quantify the economic impact of pneumonias. The following table shows the economic repercussion on a farm with an average lung lesion score of 2%.
Economic assessment
| Parameters | |
| Pigs assessed | 100 |
| Average lesion score of the assessed sample (%) | 2.00 |
| Daily weight gain | |
| DWG loss according to the % of lesion (g/day) | 7.4 |
| Weekly pig price (USD/kg) | 1.2 |
| Average value of the daily weight gain loss (USD) | $0.01 |
| Feed conversion efficiency | |
| Percentage increase in the food conversion efficiency according to the lesion (%) | 0.9 |
| Studied farm feed conversion efficiency | 2.9 |
| Feed conversion efficiency on a farm without pneumonia | 2.87 |
| Difference | 0.03 |
| Feed cost (USD/kg) | $0.250 |
| Feed cost per kg of weight gain (USD/kg) | $0.725 |
| Loss per kg produced (USD/kg) | $0.007 |
Each assessed pig loses 7.4 g/day in terms of weight gain, with a value of USD 0.01/day. In terms of feed conversion efficiency per pig, according to the lesion percentage, its feed conversion index increases by 0.9%. In the case of this farm, that has a feed conversion efficiency of 2.9, without pneumonia it would be 2.87, a difference by 0.03 points that in terms of the cost of food per kg of pig produced mean USD 0.007.
It is critical to carry out this assessment quarterly and evaluate at least 100 pigs per assessment. A routine lung score analysis together with a well trained manager will provide useful information for the making of decisions regarding the health management of the pigs.