

When we wish to control the reproductive efficiency at a farm, one of the best indicators are the non-productive days (NPD), because by means of their use it is very easy to link technical and financial performances. Normally they are defined as the days during which the sow is not pregnant nor lactating, and they should be as low as possible. The most accepted division of this period is the one suggested by Koketsu (2005) in 6 intervals, according to the moment in which they appear. Among all of them, today we will talk about the weaning-to-service interval (WTSI): it is not only important due to its direct cost, but it also affects the performance of the farm, because the pace of the services is affected if the number of sows foreseen for that week or batch is not met.
The weaning-to-first-service interval is defined as the days that pass from the weaning of a sow and the first service after this weaning. Its calculation is easy: for a group of sows, it consists in dividing the sum of the weaning-to-first-service intervals in this group of sows by the number of sows in the group. It is mainly usefull because it gives us information about two aspects that are quite related between them:
- The quality of the coming into heat of the sows after the lactation, that many times points out the kind of management/handling (feeding) carried out.
- The management/handling during the heat detection of the weaned sows, so it is a parameter to be used in order to detect mistakes in the heat detection.
This parameter fluctuates between 5.5 and 8.5 days (7.6 days as an average in the PigCHAMP database), and its effect on the farrowing rate and the subsequent prolificacy has been described, generally reducing both (Steverink et al., 1999). We must also point out that in the case of the gilts, although it cannot be considered as something normal, it is frequent to see an increased WTSI.

Which factors have an influence of the WTSI?
Among the factors that have a biggest influence we have:
- Inadequate intake during lactation. It is possible in any parity, although it is more frequent in primiparous sows, because sometimes it is complex to cater for the needs for their own growth and the milk production. This effect can be seen if during the lactarion period the requirements are not met, especially in terms of energy (Koketsu, 1995), and they are not recoverable. It is more intense in sows that lose more weight or with a lower backfat depth.
- Season of the year. Generally, in warm climates we can see an increase in the WTSI during the summer, normally derived from a decrease in the intake, rather than due to a direct effect.
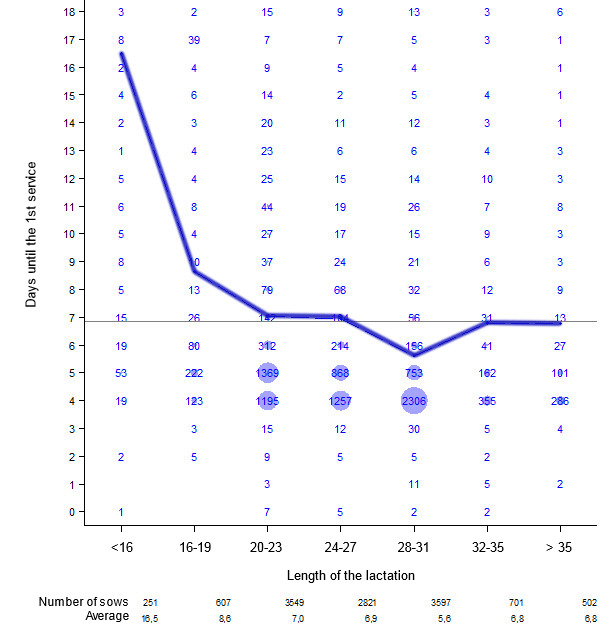
- Length of the lactation. Short lactations (under 16 d) normally lead to longer WTSIs, because the uterus has not had time to recover correctly.
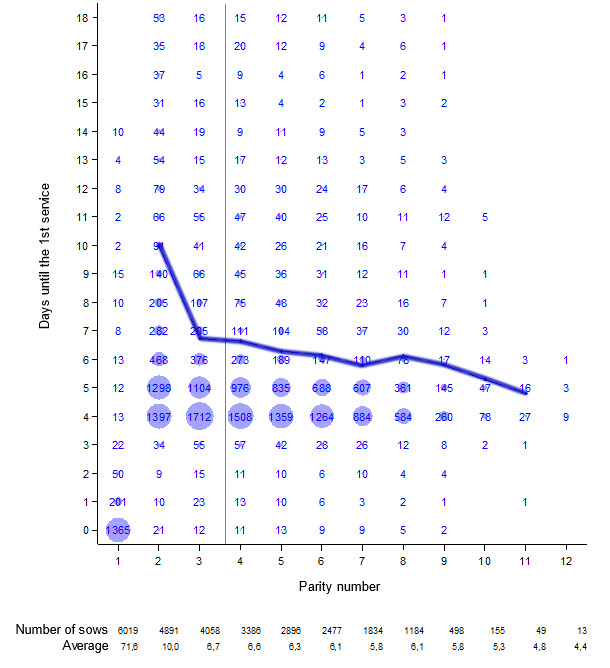
Graph 1. WTSI according to the parity number
| WTSI according to the parity number Completed on Feb 13th 2008 27,465 totally weaned sows between Jan 1st 20006 and Dec 31st 2007 (average of parity = 3.6). Graph of the parity number vs. the days until the 1st service |
Graph 2. WTSI according to the length of the previous lactation.
|
Analysis of the length of the lactation
Completed on Feb 13th 2008 12,028 totally weaned sows between Jan 1st 2006 and Dec 31st 2007 (Average length of the lactation = 25.8 days). Graph of the days until the 1st service vs. the length of the lactation (average of days until the 1st service = 6.8). |
How to control the WTSI
From the aforementioned factors we can deduce the measures for controlling it, that are:
- Assure a good continuous body condition, avoiding large variations between the body condition during the pregnancy and the lactation during all the reproductive life of the animal.
- Avoid high temperatures as much as possible. The cooling systems can be very useful in regions with very hot summers.
- Always provide the sows water ad libitum, and offer the feed dividing it in more daily meals (2-4).
- In very big litters, it can be useful to carry out partial weanings, leaving at least 7 piglets per litter, always moving the biggest piglets. We must be careful with this practice, because if we do not leave enough piglets the sow could come into heat in the lactation quarters, showing a WTSI of 18-14 d. If performed correctly, it is especially useful in the case of primiparous sows and of sows with a body condition < 3.
Finally, we must remember that we must differentiate between the WTSI or WTFSI (weaning-to-first service interval) and the weaning-to-first-fertile-service interval (WTFFSI), that are similar but that have differences that are worth knowing.
The weaning-to-first-fertile-service interval is defined as the interval until the fertile service, this is, the service that leads to a farrowing. This parameter is more complex than the previous one, not only due to its average value, but especially to its distribution. It is a parameter that also provides indirect information of the losses during the pregnancy. So, it is a value more directly related to the farm productivity. In fact, a farm may have a good weaning-to-first-service interval (if it manages to mate almost all the sows 4-5 days after their weaning), but a bad weaning-to-fertile-service interval (if it has many llosses during gestation, this is, if its fertility until the moment of the farrowings is not good). The range for this parameter is more variable, depending on the farrowing rate on each farm. In the case of the sows of the PigCHAMP database, this interval was 12.8 days, because the sows that were well mated during the proper days lost their pregnancy for some reason. It is always interesting to use breakdown tables for the analysis of this parameter, like the one shown in Table 1.
Table 1. Analysis of the losses during the pregnancy (n = 12,150 services)
| Weaning-to-first-service interval | |||||||||||
|
0-1
|
2
|
3
|
4
|
5
|
6
|
7
|
8-10
|
11-
|
Total
|
%
|
|
| 1st services |
42
|
23
|
119
|
4,911
|
3,815
|
955
|
442
|
549
|
1,294
|
12,150
|
|
| % mated sows |
0.3%
|
0.2%
|
1.0%
|
40.4%
|
31.4%
|
7.9%
|
3.6%
|
4.5%
|
10.7%
|
100%
|
|
| Weaning-to-first-service interval |
0.6
|
2.0
|
3.0
|
4.0
|
5.0
|
6.0
|
7.0
|
8.7
|
27.2
|
7.2
|
|
| Return to oestrus |
5
|
3
|
9
|
352
|
334
|
114
|
62
|
72
|
179
|
1,130
|
|
| Early return to oestrus |
0
|
0
|
0
|
5
|
4
|
3
|
0
|
0
|
2
|
14
|
|
| Irregular return to oestrus |
3
|
0
|
4
|
67
|
56
|
17
|
12
|
13
|
36
|
208
|
|
| Late return to oestrus |
1
|
0
|
2
|
109
|
102
|
41
|
22
|
23
|
57
|
357
|
|
| Regular return to oestrus |
1
|
3
|
3
|
171
|
172
|
53
|
28
|
36
|
84
|
551
|
|
| 1st oestrus regular return to oestrus |
100%
|
100%
|
100%
|
73.1%
|
76.7%
|
73.6%
|
67.9%
|
69.4%
|
77.4%
|
74.8%
|
|
| Return to oestrus rate |
11.9%
|
13.0%
|
7.6%
|
7.2%
|
8.8%
|
11.9%
|
14.0%
|
13.1%
|
13.8%
|
9.3%
|
|
| Average interval between returns to oestrus |
33.6
|
22.3
|
38.0
|
47.7
|
42.9
|
44.2
|
47.8
|
43.2
|
42.7
|
44.6
|
|
| Average NPDs |
34
|
21
|
41
|
52
|
48
|
50
|
55
|
52
|
70
|
53.3
|
40.4%
|
| Failure at farowing |
0
|
0
|
0
|
29
|
19
|
9
|
1
|
3
|
11
|
72
|
|
| Average NPDs |
|
|
|
160
|
170
|
153
|
172
|
157
|
183
|
165.5
|
8.0%
|
| Negative diagnosis |
0
|
0
|
0
|
4
|
0
|
0
|
1
|
0
|
1
|
6
|
|
| Average NPDs |
|
|
|
162
|
|
|
61
|
|
87
|
132.5
|
0.5%
|
| Diagnosis: empty |
0
|
0
|
0
|
0
|
0
|
0
|
1
|
0
|
0
|
1
|
|
| Average NPDs |
|
|
|
|
|
|
54
|
|
|
54.0
|
0.0%
|
| Abortion |
0
|
0
|
0
|
3
|
6
|
1
|
0
|
1
|
5
|
16
|
|
| Average NPDs |
|
|
|
116
|
107
|
92
|
|
32
|
101
|
101.2
|
1.1%
|
| Dead |
1
|
1
|
4
|
70
|
76
|
23
|
5
|
14
|
28
|
222
|
|
| Average NPDs |
120
|
118
|
85
|
71
|
76
|
86
|
69
|
83
|
104
|
79,9
|
11.9%
|
| Sold or abattoir |
3
|
1
|
6
|
241
|
168
|
50
|
71
|
37
|
117
|
640
|
|
| Average NPDs |
66
|
56
|
64
|
84
|
81
|
87
|
84
|
79
|
119
|
89.0
|
38.1%
|
| Total failures |
9
|
5
|
19
|
699
|
603
|
197
|
87
|
127
|
341
|
2087
|
|
| Average NPDs |
54
|
49
|
57
|
70
|
65
|
69
|
63
|
65
|
94
|
71.5
|
100.0%
|
| Late |
1
|
0
|
5
|
129
|
345
|
95
|
27
|
68
|
132
|
802
|
|
| Average NPDs |
193
|
|
199
|
191
|
208
|
208
|
205
|
207
|
216
|
206.6
|
|
| Farrowed |
32
|
18
|
95
|
4,083
|
2,867
|
663
|
328
|
354
|
821
|
9,261
|
|
| Delayed farrowing |
0
|
0
|
0
|
0
|
0
|
0
|
0
|
0
|
0
|
0
|
|
| Farrowing rate |
76.2%
|
78.3%
|
79.8%
|
83.1%
|
75.2%
|
69.4%
|
74.2%
|
64.5%
|
63.4%
|
76.2%
|
|
| (> 125 days) |
100%
|
100%
|
100%
|
100%
|
100%
|
100%
|
100%
|
100%
|
100%
|
100%
|
|
| Average born alive |
10.7
|
10.8
|
12.2
|
11.4
|
11.2
|
11.0
|
10.8
|
10.9
|
11.3
|
11.3
|
|
| Average stillborn |
0.8
|
1.6
|
1.4
|
1.1
|
1.1
|
1.1
|
1.0
|
1.0
|
1.1
|
1.1
|
|
We can see the weight of each of the different kinds of losses uring gestation on the difference between the WTFSI and the WTFFSI intervals (logically, if a farm had a fertility rate until the moment of the farrowings of 100%, both parameters would be equal).
Finally, a goal that is easy to remember: we must have mated > 90% of the sows 7 days after their weaning. Monitoring this parameter should help us to keep an adequate flow of matings/services at the farm.
