

Given that it facilitates marketing and optimizes premises occupancy time, live weight (LW) homogeneity of pig batches during fattening, especially on arrival at the slaughterhouse, is an element of great interest in the pig industry.
Analysing the days elapsed to reach a certain weight at slaughter could be one way of visualizing the animals degree of homogeneity throughout the production cycle. Thus, very homogeneous batches are expected to increase fattening efficiency, both in terms of number of days necessary to empty the premises and of conversion rate.

While certain management strategies such as grouping weights can reduce weight variability, having a tool to help make objective decisions on this issue could be of great interest. Thus, the use of mathematical modelling to establish growth curves could be a great help. Our own results have recently shown that by using these curves it is possible to obtain valuable information about our animals, and even to study differences in growth based on certain factors of interest, such as gender or genetics.
Let's say we have a complete set of about 350 weaned pigs weekly [Pietrain × (Landrace × Large White)], males and females, obtained on commercial terms and that their live weight (LW) is controlled from birth to slaughter (Figure 1). The results allow us to adjust a growth model individually and, consequently, to predict the number of days necessary to reach slaughter weight (in this case, 105 kg). We will only discuss here how we could manage this variability, without an in-depth analysis of the animals gender and genetics.
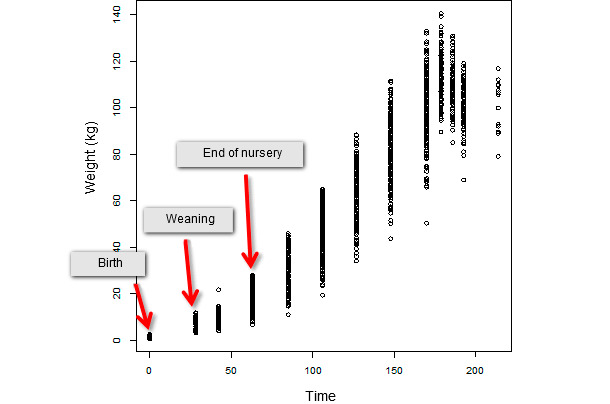
Figure 1. Evolution of live weight over time of an entire population consisting of 347 weaned animals.
Initially, we could choose to group the animals according to their weight categories (Figure 2), segregating 10% of the smallest animals in order to monitor their growth compared to the average population, or the 10% of bigger animals. In practical terms, the frequency analysis of each of the weights may be used to establish these weight categories. From these frequencies, and focusing our attention on the smallest animals, we set the cut-off by selecting the 10% of pigs with the lowest LW, which will be assigned category L ("Low" or small). For the remaining two categories (H: "High" or large and M: "Medium") we would proceed in a similar way, but this time selecting the 10% and 80%, respectively.
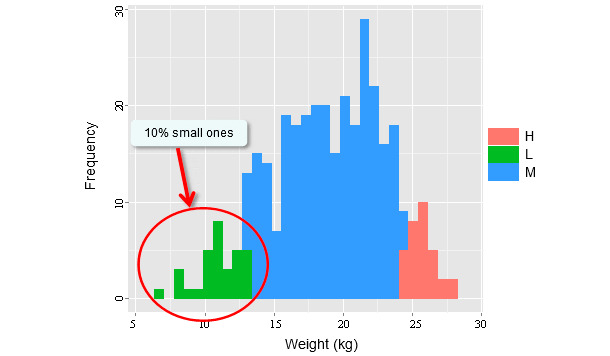
Figure 2. Weight categories created at 35 days post-weaning, where H: "High" or larger (10%), M: "Medium" (80%) and, finally, L: "Low" or small (10%). The red circle indicates the 10% of small animals chosen to be treated differentially as a strategy.
Once the LW categories are established, it is also possible to examine the variability present in each one of them (Figures 3-5), similarly to what we did with the total number of animals (Figure 1).
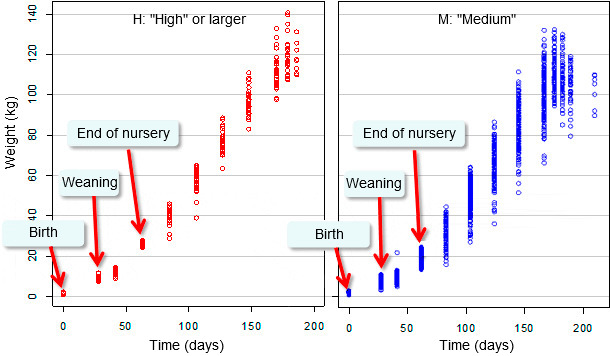
| Figure 3. Evolution of live weight of category H ("High" or larger) pigs over time. |
Figure 4. Evolution of live weight of category M |
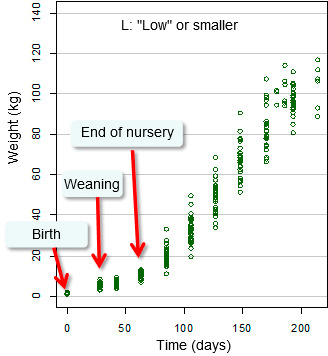 Figura 5. Evolution of live weight of category L (“Low” or small) pigs over time. |
Depending on the weight category, and with the help of the growth curves, it is possible to estimate the number of days every animal needs to reach 105 kg (Figure 6), as well as the difference in number of days between the "best" (red) and the "worse" (green) group of pigs to reach the same LW at slaughter (up to 40 days on average in our example).
One question these results raise is: how would these curves evolve if the percentage of young pigs we could give differential treatment to were different (i.e., 5%, 15% or another)?
Given that variability between the animals LW increases as they grow (Figure 1), treating a fraction of the smallest ones differentially might be of interest in holdings that could incorporate this management routine on a logistics level because, their growth being slower (with a few exceptions), they are responsible for increasing occupancy during fattening.
Furthermore, assuming that birth weight may not be, in many cases, decisive in the final stages of the production cycle, and that the animals are perhaps too difficult to handle in the final stages, we should consider choosing another stage of the cycle to facilitate the task of segregating them. A stage where the animals are taken to another location (end of nursery), as in the example at hand, might be a good one.
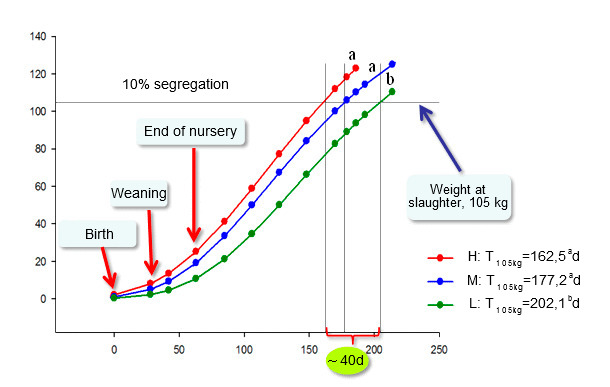
Figure 6. Evolution of average live weight of pigs over time, depending on weight category at the end of nursery (35 days post-weaning with an average lactation of 28 days.) Statistical significance set at p <0.05. T105kg is the number of days necessary to reach a slaughter weight of 105 kg. Different a, b, c letters indicate significant differences.
Finally, we should note that since segregation was carried out theoretically and a posteriori, the results don't show the ultimate effect of this measure in the field. For that we would have to know the effect actual segregation would have on productivity performance and the number of days needed to reach a given LW on the bulk of our pigs.


