

As you probably know, the name pig333 web comes from the length of the sow's gestation, which is "3 months, 3 weeks and 3 days". This paper proposes the necessity to review the length of gestation on our farm.
In our daily work we come across a variety of opinions on the usefulness of data recorded on farm and their management by farmers. This range of views spans from farms that do not even have management software, to places were even the least relevant data are recorded and analyzed. However, the case that still strikes us is the one where many data are recorded and entered into the software, but no information is extracted from them.

The real case we present in this article belonged to this group, a farm where they record the data and enter them into their software but they don't analyse them any further. This farm came to us looking for a solution to their farrowing problems: "Something's wrong, but we don't know what it is," the farmer told us.
This is a farm where stage I and II pigs are reared, with a census of around 700 hyperprolific sows, on a 3-week batch system and PRRS positive without symptoms. Before visiting the farm, we asked the farmer to provide their farm data in order to analyze then and target the most problematic areas.
All we knew was that, on average, less than 10 piglets per litter were weaned (Figure 1), the average preweaning mortality (PWM) was 15% —without diarrhoea or signs of other pathological conditions— and, in theory, management in the first days after birth was adequate, so we prepared for a complex and lengthy analysis.
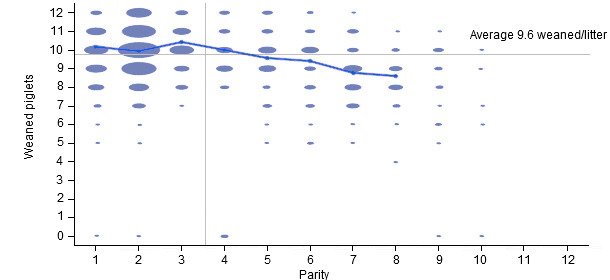
Figure 1: Weaned piglets per litter in the 6 months previous to our intervention.
To our surprise, the "complex analysis" for which we mentally prepared, did not materialize. In one of the first reports we extracted from the data, "Gestation Length Histogram " (Figure 2), we found that nearly 80% of these hyperprolific sows were farrowing after 114-115 days of gestation, something that does not substantiate our experience with this type of sows, for which farrowing usually takes place on day 116 or even 117.
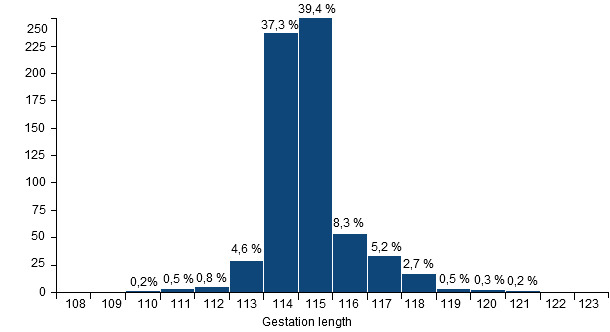
Figure 2: Gestation Length Histogram. It indicates that farrowing is systematically induced to take place on day 114.
We found, therefore, evidence that they were inducing farrowing too early, thus producing low birth weight, low vitality piglets. We proved this link in the past, when we found differences in weight of up to 300 grams per piglet on average (Figure 3), differences even more pronounced when comparing piglets produced by gilts.
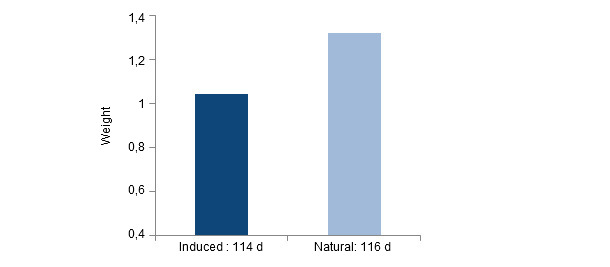
Figure 3: Birthweight differences between piglets from induced (day 114) versus natural (day 116) farrowings in hyperprolific sows.
From that moment, the analysis focused on the search for other common consequences in such cases, such as a high percentage of stillborn (SB) pigs or a high incidence of PWM on the farrowing date.
The percentage of stillborns ranges between 10.7% and 6.7%, with an average of 8.4% (Figure 4). These values are not very high compared to those found in other occasions, but they can be improved.
| Total from 14-jul-2013 to 15 apr 2014 | |
| Parities (litters) | 1357 |
| Assisted farrowing | 0 |
| Induced farrowing | 0 |
| Litters with less than 7 born alive | 82 |
| (as % of the litters) | 6.0 % |
| Total born | 16502 |
| Total born/litter | 12.14 |
| Born alive | 15124 |
| (% of total born) | 91.6 % |
| Born alive/litter | 11.12 |
| Stillborns | 1378 |
| (% of total born) | 8.4 % |
| Stilborns/litter | 1.02 |
| Mummifieds | 0 |
| (% of total born) | 0.0 % |
| Mummifieds/litter | 0 |
Figure 4: Production Trends Analysis. Farrowing data.
Unfortunately, we could not evaluate the distribution of death losses in suckling pigs because, although this event was correctly registered in the daily reports, the manager dated them all on the farrowing day when introducing the data into the software (Figure 5.) This is a relatively common mistake that often hinders the work of the farm vet when farrowing problems arise.
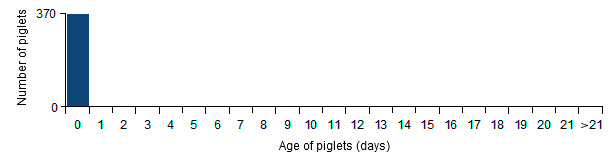
Figure 5: Analysis of piglet mortality. Distribution by age.
Once the potential main cause of high mortality at farrowing has been identified, the next step is to visit the farm and confirm our suspicions.


