

Feed costs are the single greatest cost of pork production. Therefore, understanding the market dynamics of feed ingredient costs is crucial not only to manage overall costs of production but to ensure effective strategies in purchasing, margin hedging, peak line of credit acquisition and liquidity or financial risk management. The period of the 1990’s to the mid-2000’s saw relatively stable costs of production. With the exception of 1995 for corn and 2003-2004 for soybeans, feed ingredient costs were relatively flat. However, since 2006 when ethanol production reached a critical mass in the United States and began absorbing the historical supply cushion for corn stocks, feed ingredient prices have been very volatile. This makes managing costs and short term lines of credit for variable input acquisition especially difficult but nonetheless crucial both for realizing operating profit and gaining access to adequate leverage (debt).
Examine the pattern of corn and soybean meal price volatility in Figure 1. After 2006, price volatility for both feed ingredients escalates dramatically due to several factors. The most important factor for corn has been the competition for supply by ethanol distillers which now surpasses 40% of the total U.S. corn production and since 2011, exceeds all livestock use. Corn and soybeans are produced largely on the same farmland. As corn producers raced to plant more and more highly profitable corn, available acres for soybean production decreased, resulting in smaller soybean crops and higher prices for both inputs. Even though the collapse of world markets in 2008 saw commodity prices drop precipitously, they were soon off and running again as world demand began to rise and temporarily shuttered ethanol plants came back on line with rising oil prices. The drought of 2012 dramatically impacted feed ingredient prices and the current “flash” drought of 2013 is likely to marginally diminish corn and soybean production, which only a month ago seemed headed for a record harvest.

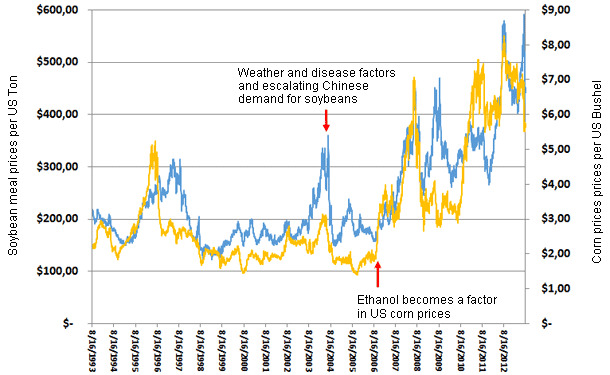
Fig. 1. U.S. Decatur-Central Illinois Soybean Meal (46.5-48%) and U.S. Corn Price per Bushel 1993-2013 (mid August)
Careful planning is now essential for the cost effective acquisition of feed ingredients. The physical acquisition of feed ingredients (or feed) takes place on a more or less uniform basis throughout the year matched to the consumption needs of the animals. However, the timing of the pricing of those ingredients through purchase contracts or hedging etc. is usually done when the producer believes the prices are most favorable.
Gaining insight into how prices are likely to move and the range they will move within over the future planning horizon is very valuable information for cost effective purchasing. This means understanding the likely future distribution of feed ingredient prices has become necessary and much more valuable than projecting a single average price for cash flow budgeting, peak line of credit planning, cost of production projection and margin locking/risk management activities. Most producers came of age in the business when costs were very stable and are much more likely to think of prices as single points instead of distributions. That needs to change.
Price distributions define the range over which prices are likely to move and the frequency or probability they will be within certain parts of that range for varying lengths of time. Think of the classic bell shaped curve, which is typically a normal distribution. The central part of the distribution is highest around the average or expected prices. The height of the bell shaped curve reveals that range where prices are expected to fall most of the time (near the average). The tails (each end) of the distribution are declining in height, (getting flatter) which illustrates the probability that extremely high or low prices are unlikely, but not impossible to occur.
The big change that has happened since 2006 is that the corn and soybean meal price distributions have changed and become skewed, leaning to the left with a long upper tail. This reflects the fact that while a drought or plant disease may result in extremely high prices, not even an historically high harvest is enough to drive prices extremely low due to the supported demand by ethanol distillers.
To illustrate this point, I performed an exercise using the distribution of corn and soybean meal prices for the last five years. I used a Monte Carlo technique to randomly sample a thousand pairs of corn and soybean prices such that those price pairs selected would on average, be correlated in the same way that corn and soybean meal prices have been correlated over the last five years. Figure 2 provides the result of that exercise. Note that there is a very stable range (within the circle) where we can expect the prices to be most of the time. However, when there is a breakout from that range, the result is always toward higher prices and therefore higher costs. Next time we will take a look at how this information can be used to make better pricing decisions (than using average prices for planning) and how your banker can be put at ease when losses mount if you speak to him or her in the language of distributions in the early stages of planning.
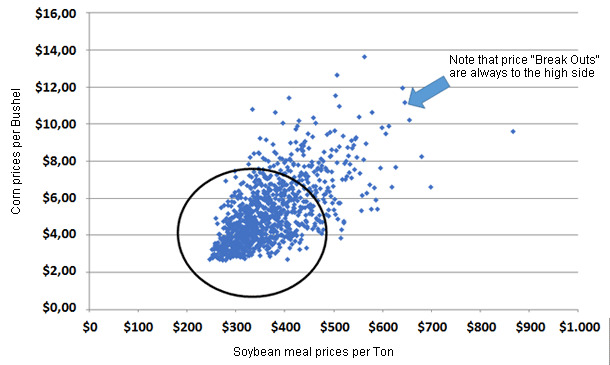
Fig. 2 Corn and Soybean Meal Price Combinations Using Monte Carlo Simulation of 2008-2013 (Mid August) Correlated Corn and Soybean Meal Price Distributions