

Infrared radiation is emitted by any body which temperature is higher than 0 Kelvin, this is, −273.15 Celsius degrees (absolute zero). In the electromagnetic spectrum, the infrared radiation is in the range of 0.78 to 100 µm, out of the visible range for the human eye (0.38-0.78 µm). Thermography is a technique that allows the measurement of exact temperatures from a distance without the need of a physical contact with the object to be assessed using a thermographic camera that records the intensity of the radiation and transforms it in a visible image.
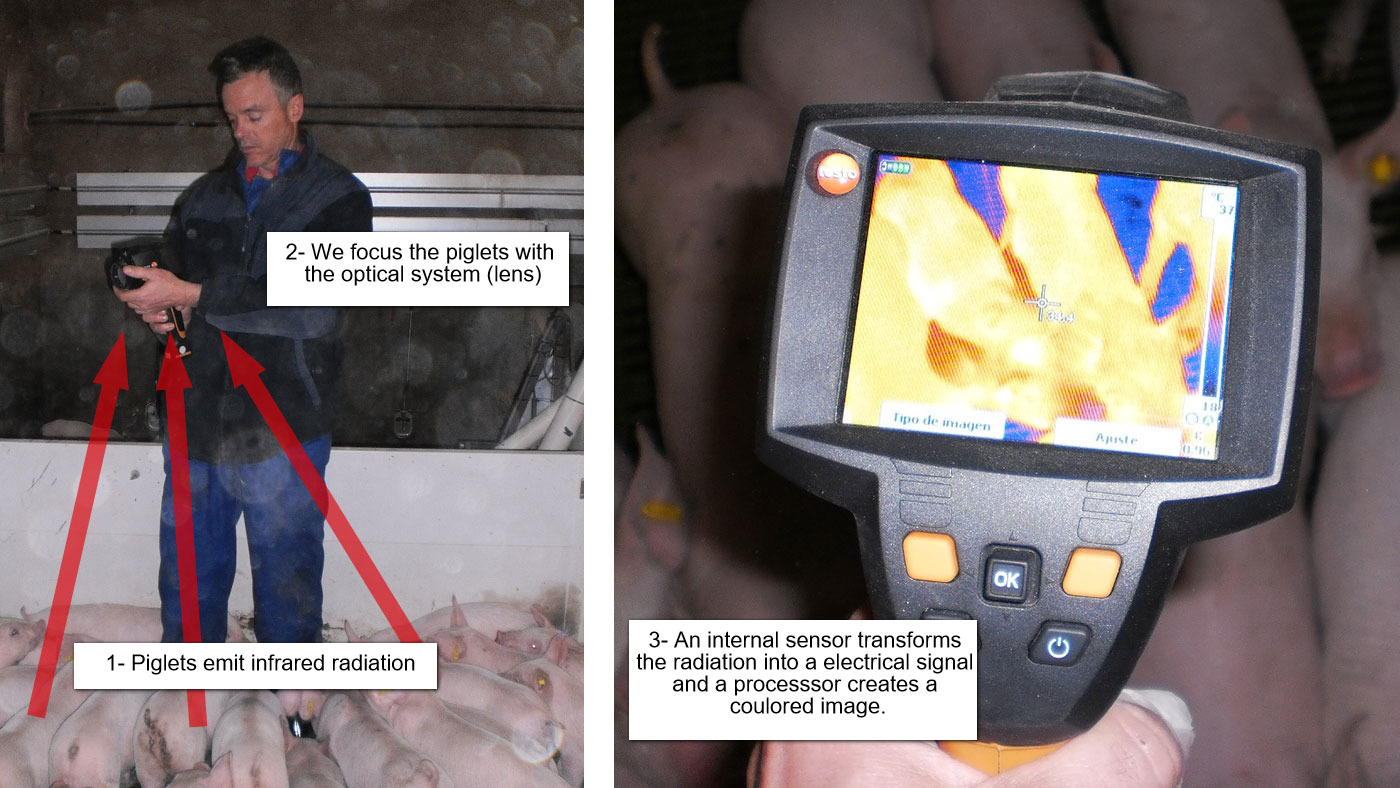

How does a thermographic camera work?
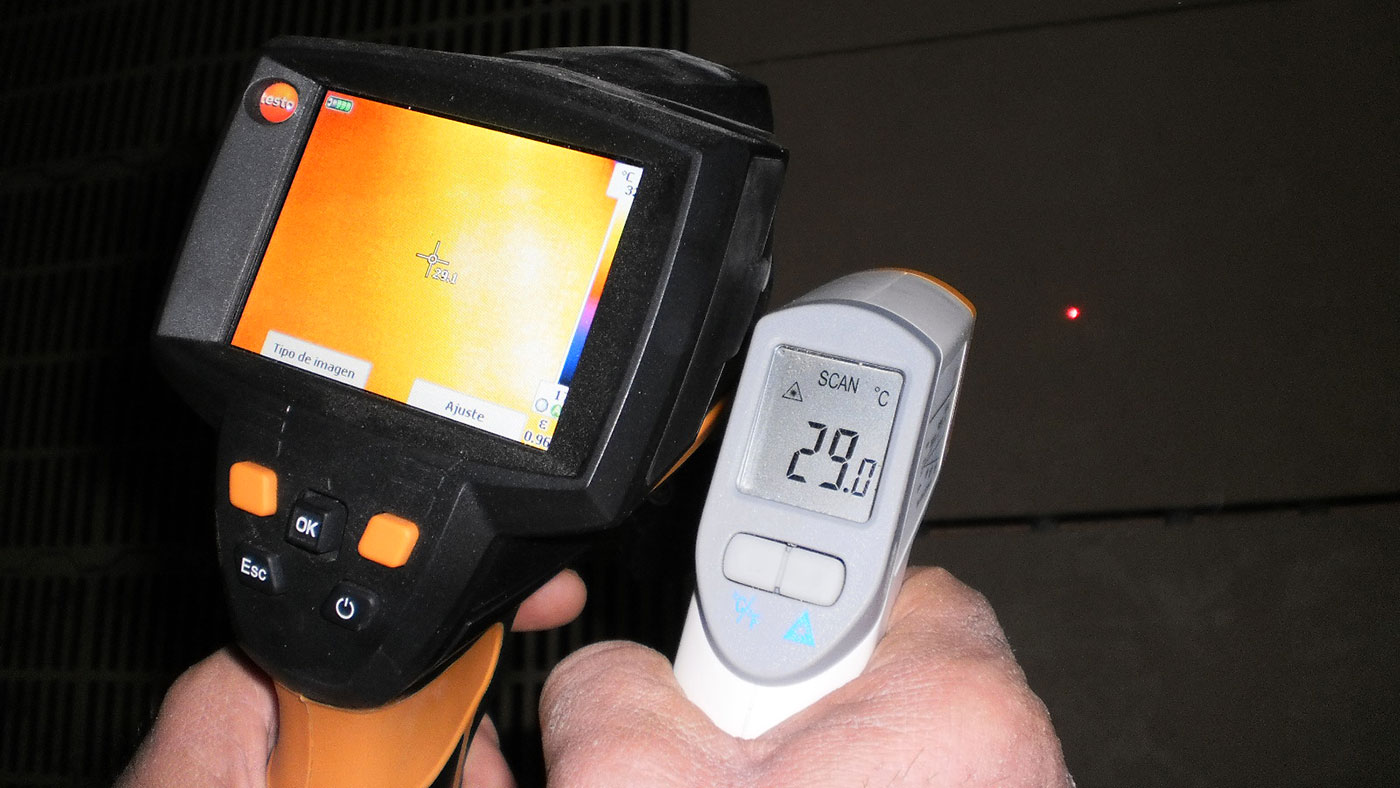
The infrared thermometers can also measure temperatures from a distance, but only in one point. The thermographic cameras can measure the temperature in all the image with resolutions that are equivalent to 19,200 infrared thermometers at the same time.
“The tools that we are using in the farm are focused towards the comfort of the animals and the energy efficiency.”
1. 1. Check the thermal insulation level :
The goal of the thermal insulation is to hinder the transmissions of heat from the inside towards the outside and vice versa in order to avoid the heat losses during cold seasons and the heat gain during hot periods. A correct isolation allows the saving of energy, the comfort of the animals, the reducing of condensations, the good keeping of the building, and the correct dimensioning of the heating and cooling system. We shall also have a better internal control of the temperature and of the air movement.
Design and construction diagnosis: The insulation must “pack” the building, it must be continuous and it must have the same thickness.
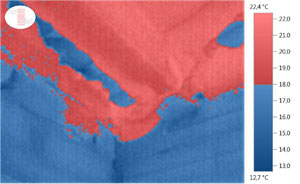
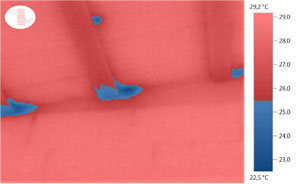
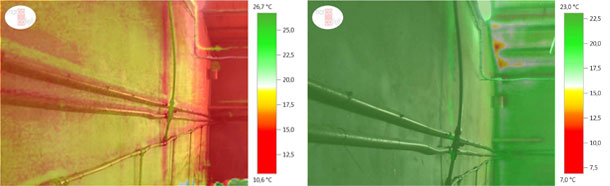
In image 1 we see a bad insulation of the façade (blue) but an acceptable one in the roof. It is discontinuous, causing differences in the surface temperature of 10 ºC that increase the risk of condensations and a bad control of the temperature and of the air circulation. In image 2, except for the small thermal bridges (blue), that should not have a significant influence, the insulation level is correct in the roof and in the façade.
| Image 1: Thermographic image (scale with limit values) of the façade and of the internal ceiling in the weaner pigs unit (winter). | Image 2: Thermographic image (scale with limit values) of the façade and of the internal ceiling in the weaner pigs unit (winter). |
|
Outer environmental temperature: 4ºC. Inner environmental temperature: 19ºC |
Outer environmental temperature: 4ºC. Inner environmental temperature: 27º C |
Preventative maintenance: Early detection in order to reduce costs.
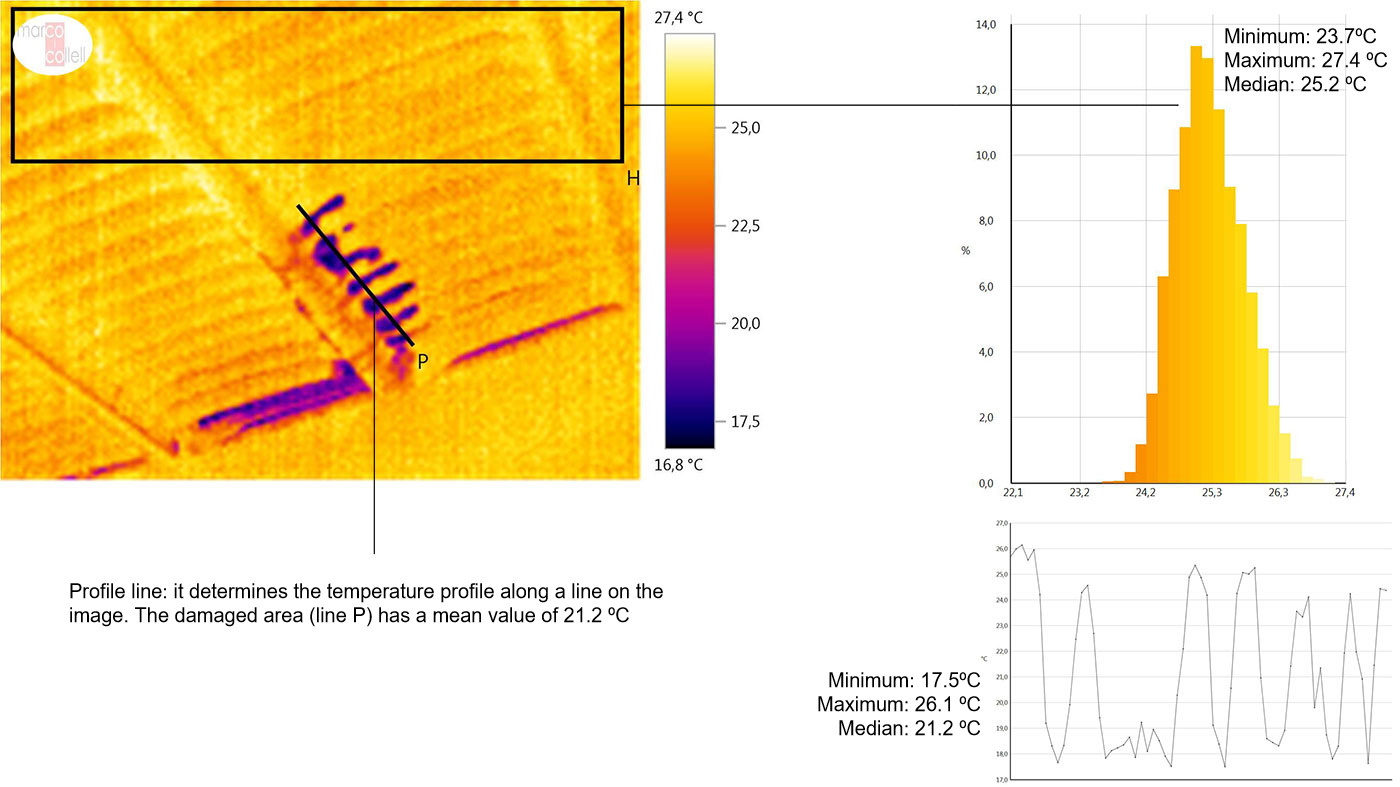
Image 3: Thermal image of a roof in a gestation unit (winter). We can see small areas in which the insulation is deteriorating. Determination of a histogram in an area of the image. Area with a correct insulation (rectangle H) and with a mean value of 25.2 ºC.
The repairs will have a low cost if we carry out a periodical preventative maintenance and we detect all the problems early on, as in the case of image 3.
2. V erifying the absence of condensations, dampness and spreading of moulds :
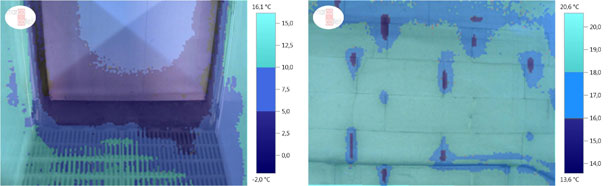
The dampness due to the condensation is caused when the surface temperature of a wall is lower than the environmental dew point. Measuring the dampness we can know the risk of condensation in each measurement point. With the thermographic camera we visualize the areas with a higher risk with a red colour (>80%) and those with a lower risk with a green colour (<65%). The rest of colours (yellow-orange) show those areas with an intermediate risk (65-80%).
Monitoring: Detecting areas that pose a risk for the comfort of the animals and for the deterioration of the structures.
| Image 4: Image superposition (thermal + digital) showing a high probability of condensations. |
Image 5: Image superposition (thermal + digital) showing a low probability of condensations. |
In image 4 there is a high risk. We will have to detect the cause (there can be multiple causes) as, for instance, the insulation, the thermal bridges, the airing, the animal density, the heating, etc. In image 5 we see a low risk because the conditions are correct.
3. C heck that there are no significant thermal bridges .
The thermal bridges are areas of the enclosure of the building where we can see a variation in the uniformity and in the thermal resistance of the construction, whereas this is due to a change in the thickness of the closure, the materials used, the penetration of construction elements with a different conductivity, etc. They are also sensitive areas where there is an increase in the appearance of condensations during the cold season.
Monitoring: Detecting areas of the enclosure with a lack of uniformity in new premises (construction quality) and in premises that are already in use (preventative maintenance).

| Image 6: Image superposition (thermal + digital) in order to analyse the surface temperature differences (winter). We can see a lower temperature in the roof beams, the joints and the junctions between the façade and the roof, and a presence of cracks in the walls. | Image 7: The same photographs (thermographic + digital) superimposed in order to show the higher probability of condensation due to the lack of continuity. Risk of condensation based on the image colour (red: critical, green: not critical). |
The thermal bridges cause temperature differences (image 6) and a risk of condensation (image 7). The solution is based on prevention, the control of the initial quality or the periodical repairing, that has a low cost if we detect their appearance early.
4. C heck the absence of air infiltrations .
An infiltration is the passing of air through gaps in windows, doors, pits, holes in the walls, etc. The energy performance of the room and the comfort of the animals are affected in an important way due to the infiltrations. Due to this, we will have to find them and find a solution. There are kits for the evaluation and the quantification of the existing infiltrations in the enclosure that work by means of a “pressure test”. The thermographic camera will complement the qualitative diagnosis of these infiltrations.
Preventative maintenance: Diagnosing and solving the unwanted air entrances.
| Image 8: Thermographic image (scale with limit values) with air infiltrations through a doorframe (weaner pigs unit, winter). | Image 9: Thermographic image (scale with limit values) with air infiltrations through the inner wall due to a lack of insulation (weaner pigs unit, winter). |
The sealing of the building has to be excellent and we can check it periodically. In the majority of the cases it is more difficult to diagnose infiltrations than to solve them. Images 8 and 9 are classical examples.
5. 2. Control the active energy systems :
Once we have checked that the design “passive actions" (insulation, sealing, etc.) are adequate for the minimization of the “active” energy demand (heating, cooling, etc.), we will also have to verify with the thermography if they work correctly. We will see 2 examples.
Heating systems:
The heating of the environment by means of convection thanks to a simple finned pipe. It is capable of supplying some 150 W for each pipe linear metre (if the water temperature is >70 ºC). In image 10 we see that both lines are short, especially the lower one. The solution is not to install more meters of pipe, but to increase the water temperature.
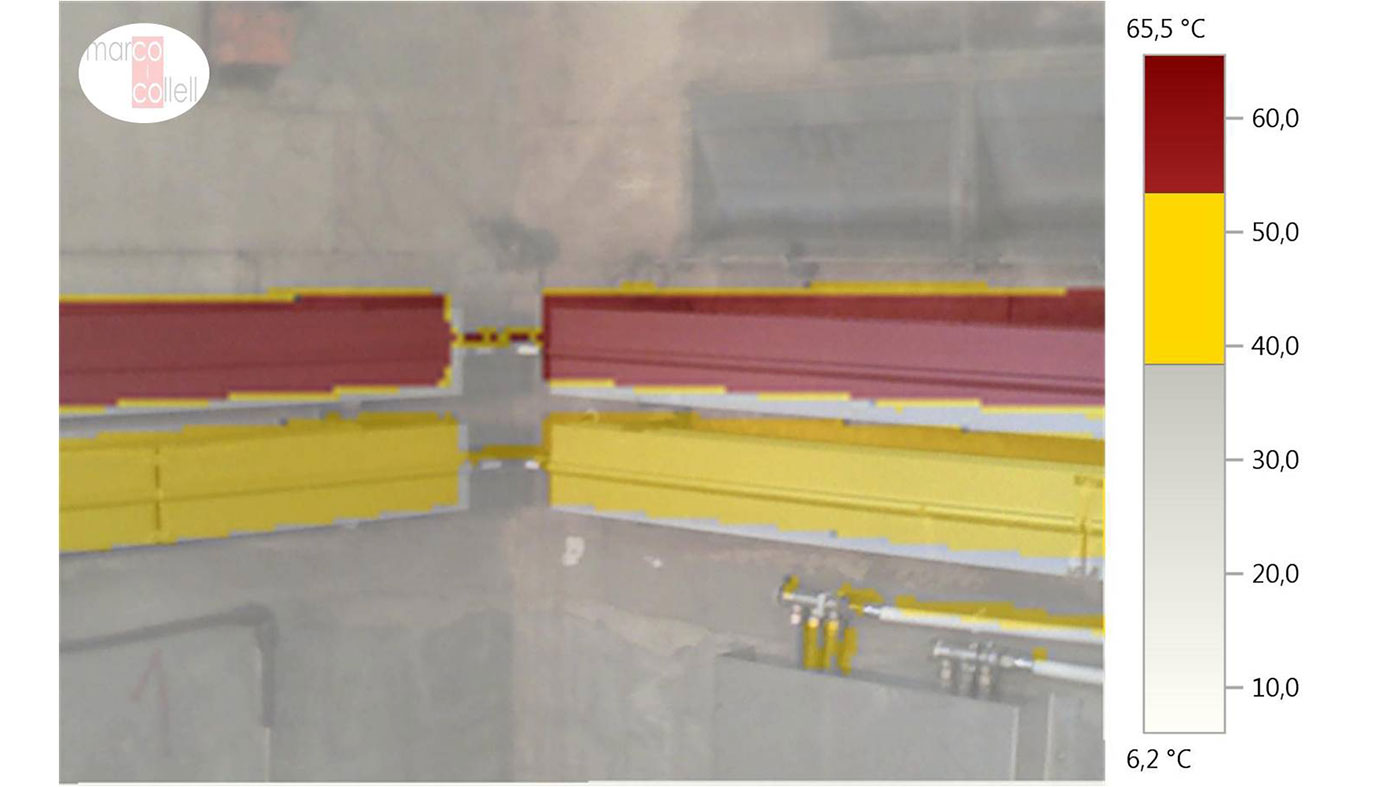
Image 10: Image superposition (thermal + digital) in order to analyse the working of the convection heating in a weaner pigs unit (winter). The temperature of the upper line (red) is between 53.5 and 65.5 ºC. The temperature of the lower line (yellow) is between 38.5 and 53.4 ºC.
Cooling systems:
The evaporation cooling system is an effective method to avoid stress due to the heat, as long as it works correctly. Image 11 shows that the surface temperature (red and yellow) is not sufficiently low for the internal cooling process. We see “dry areas” (red) that reduce the comfort. Also, in the yellow areas, and due to lime scales in the panel, the fan works more forcedly (resistance) and consumes more energy. This panel needs maintenance or it must, simply, be replaced.
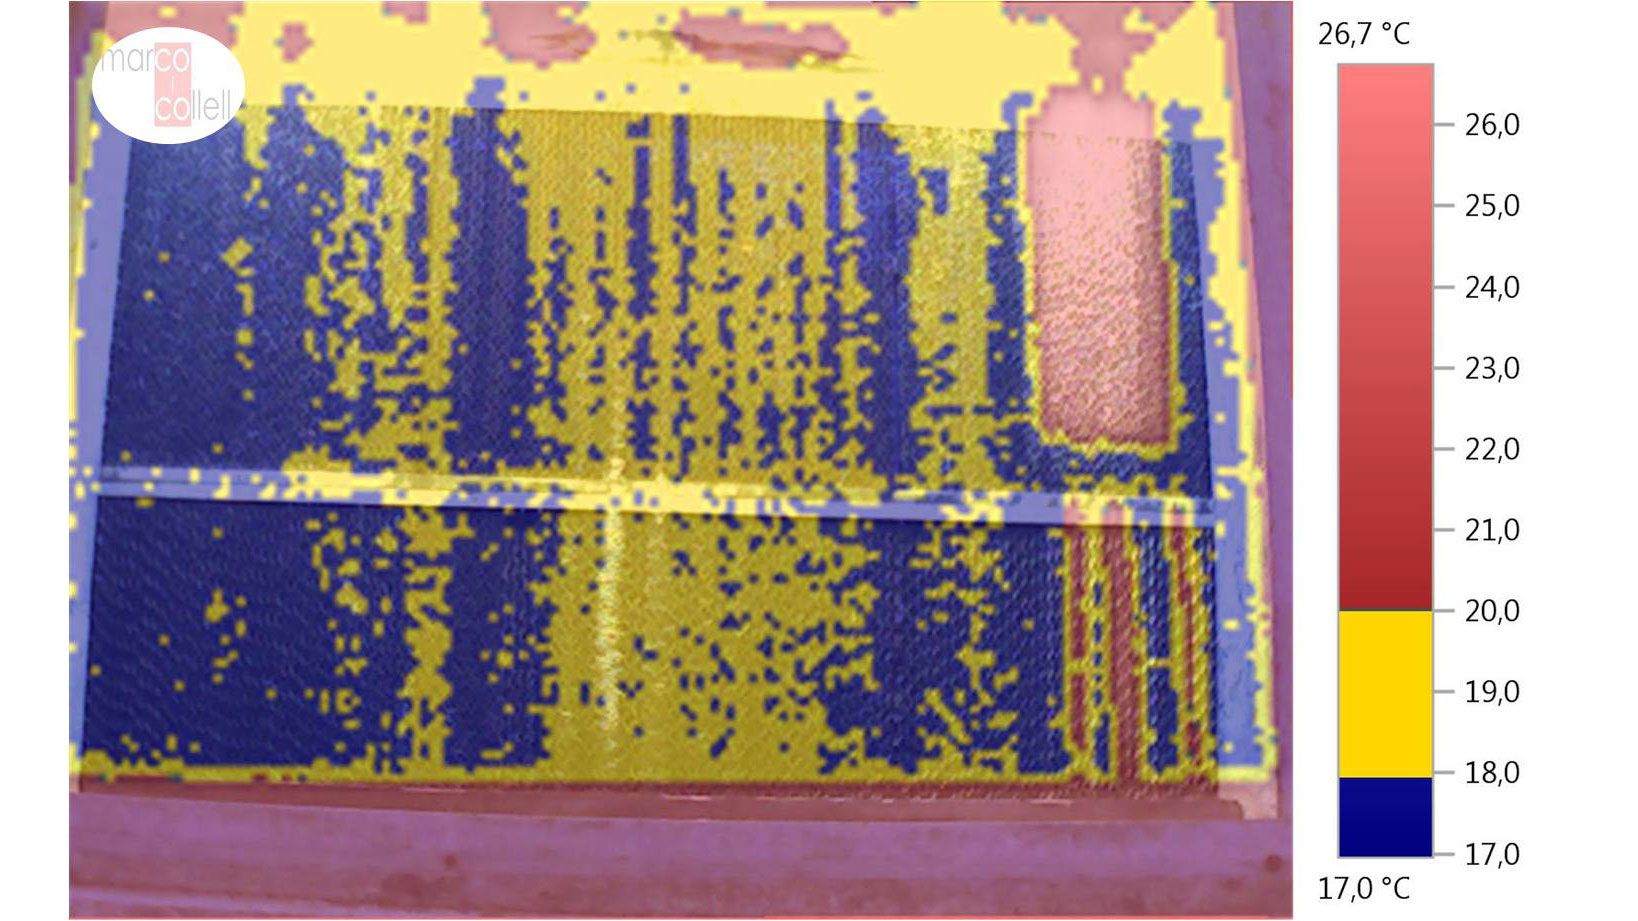
Image 11. Image superposition (thermal + digital) in order to analyse the working of the cooling panel in the gestation unit (summer).


