

Given the trend towards globalization and subsequent strong competition, current pig production forces pig producers to be more efficient or, in other words, to improve the productive parameters as much as possible. One of the factors that help to achieve high efficiency is the best possible sow herd structure. Generally, it has been accepted that the best parity distribution has a triangular shape, with a constantly decreasing % of sows. With slight variations, this sow herd structure would be as follows:
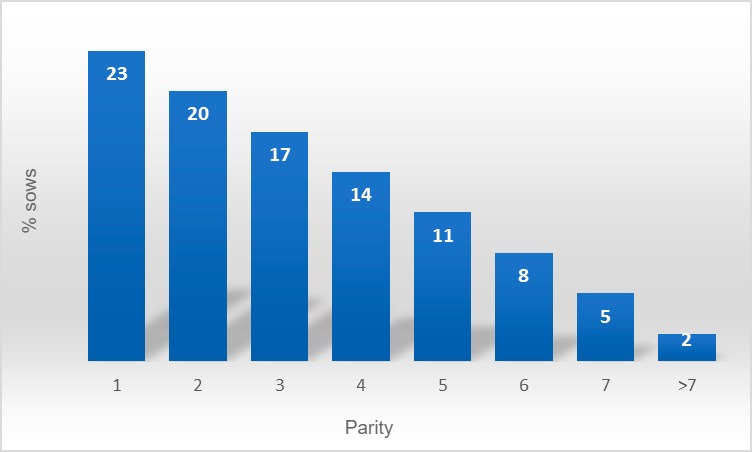
Figura 1. Sow herd structure A

Indeed, this parity distribution structure is very good, and helps productivity, but is it really the best one? In our opinion, there is a better sow herd distribution, and we explain it below. (census structure B).
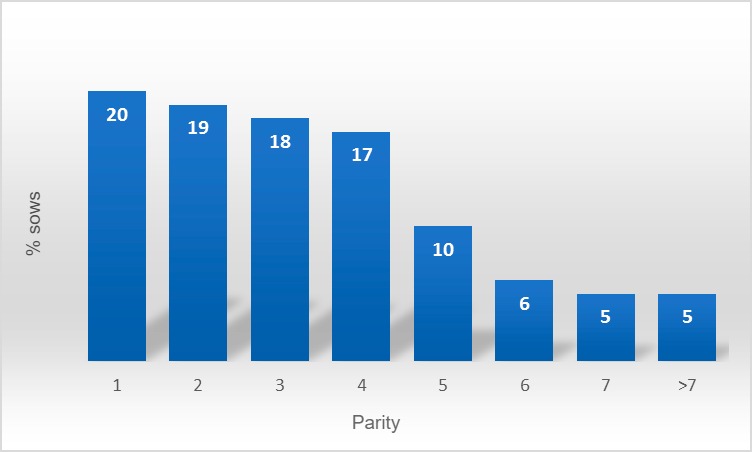
Figure 2: Sow herd structure B
First of all, this parity distribution also has a decreasing census and therefore can be sustained over time.
To explain the differences between both strategies, the two are displayed overlapped. Let's analyse, first of all, the differences in the young sows group.
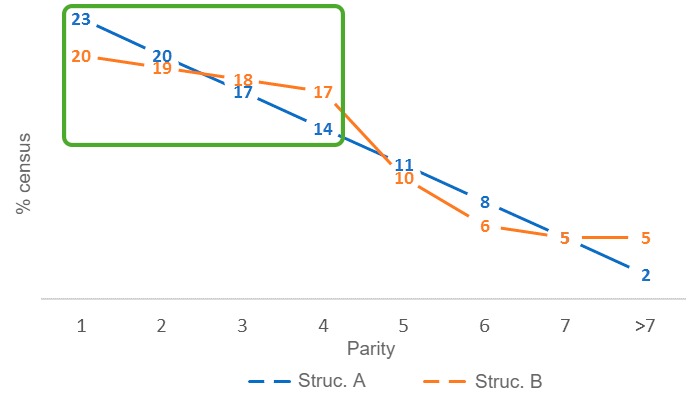
Figure 4. Differences in young sow rates between herd census structures A and B.
- The percentage of sows in the first parity is lower in the B distribution. This means that it needs less annual replacements to sustain itself, which results in an economic saving.
- The B distribution, despite having fewer sows in the first cycle, has a higher percentage of sows in the most productive cycles, 3-4. This is achieved because the slope in the B distribution is less steep in these first cycles, which means, less sows are culled in the first cycles.
This is the first key point of this distribution structure: achieve the lowest possible culling rate in young sows. And, as it was explained in the previous article of this section, (How to reduce the replacement rate and have a better parity distribution), this must be achieved not by keeping young sows at all costs, but by avoiding reproductive failures and problems that may cause early culling as much as possible.
Looking at the second half of the census distribution, the comparison is as follows:
Figure 4. Differences in old sow rates between herd census structures A and B.
The B distribution has even more old sows that the A one, therefore, why should it be better?
In a traditional culling policy system a maximum number of farrowings is set, after which sows are culled. Hardly any sows are killed before this parity, and very few sows are left after it. But, what would happen if we changed this policy and we based it on sows´ performance?
This is better understood with an example. If we could choose which sow to cull after weaning between a 7th-parity and a 4th-parity sow, we would usually choose the 7th-parity one. But, what happens if the productivity of both sows is analysed and the results are the ones showed in the next table:
| Sow | Gen. line | Par. | Av. TB | Av. BA | Av. Weaned | Av. farrowing interval | Av. BA/year | Av. weaned/year |
| E805 | CAM | 7 | 14.57 | 13.43 | 12.71 | 150.7 | 33.66 | 31.02 |
| B191 | L1020 | 4 | 9.25 | 8.50 | 7.50 | 164.7 | 20.39 | 17.45 |
Therefore, the question to be asked in order to select the sows to be culled should be changed. A better question would be:
Which sow has a higher probability of providing a better performance in the next farrowing? In the example, it seems clear that the older sow has more chances of doing better, despite the number of farrowings it has had.
Therefore, to achieve this type of second part of the census, a selection is done around the 4th cycle (when there is already enough information on the sow´s history to make a decision based on performance), removing the worse sows (this is why there is a reduction in the 4th and 5th cycles).
In return, to avoid reducing the average age at culling, the best sows are further “squeezed”, which means, they stay longer in the herd.
In herds where this management is carried out in a proper way, the older sow group achieves the same performance or even better than the herd average.
In summary, the procedure consists of selecting the sows to be culled based on the sow's performance, thus removing the less productive sows earlier and keeping the ones with a better performance for longer.
This distribution structure has some advantages over the traditional triangular one (a lower replacement rate, more sows in the productive cycles, better old sows) that will help improve reproductive efficiency.
This is an example that we cannot take anything for granted, because new ways can always be found of improving virtually all aspects of production that help improve efficiency, and therefore, the ability of our herds to compete.
