In real practice things are never black and white. This is especially true when data is being collected to demonstrate a particular association between variables. At times when we are looking to establish a pattern in our observations we end up questioning our own observations because issues are never absolute (i.e. black and white). Patterns of association are quite helpful in helping focus resources whether that is time, money, or any intervention we are seeking to implement. Odds ratios (OR) are a statistical/epidemiological tool that can be utilized to show associations between two binary variables. The calculation of OR requires data be placed into a 2 X 2 table and therefore data has to be formatted into a categorical manner (e.g. yes and no for two separate variables).
Table 1. General data layout for a 2 X 2 table.

| Variable 1 | |||
| yes | no | ||
| Variable 2 | yes | a | b |
| no | c | d | |
Using the above Table 1, OR can be calculated by simply cross multiplying and dividing. Therefore:
(a*d)
OR= -----------
(b*c)
The nice thing about OR is that one does not have to worry about the order of variables (which one is on top or to the side) as the calculation will result in the exact same value. From the above formula one realizes that the value of OR will always be a positive number and it will vary between zero and infinity. Interpretation of OR is as follows:
OR<1 indicates a “protective” association, meaning that an event is less likely to occur
OR=1 indicates that there is no association between two variables
OR>1 indicate an association is present with high values indicating stronger association
A 95% confidence interval (95% CI) can also be calculated for the OR and thus provide a range of the true expected value. The formula is not that complex. A key point is that when an OR is calculated with its respective 95% CI, if the interval includes the value of “1” then it means that the association is not statistically significant and thus the results could just be due to chance alone.
It is important to emphasize that OR calculations do not mean cause and effect, they simply suggest there is an association. For example, tall people are much more likely to wear pants with longer inseams than shorter people. There are short people that like to wear long length pants due to fads. So although these two variables (tall and pant length) are associated it does not mean that simply buying long length pants will make you taller (i.e. no causation).
To better understand how one can use OR to demonstrate an association let’s look at a couple of examples with field data.
Pneumonia and stomach ulcers
One of my colleagues was looking to identify if in fact, in their particular system, stomach ulcers were associate with pneumonia. We do know that there are multiple causes for stomach ulcers. Initially the question may be “If we implement a vaccination program for respiratory pathogens could that help decrease the incidence of stomach ulcers?” Although many may want to start by designing a study that can address this question, in the field the first questions needs to be different. The first question in this case really should be “In our system, is there an association between pneumonia and stomach ulcers?” This is an important question because to be able to have an effect on the outcome, there must first be an association. Remember again that an association does not demonstrate or prove causation. Just because pneumonia and ulcers are associated in a particular system it does not mean that by preventing pneumonia they will necessarily have any significant impact on stomach ulcers (causation).
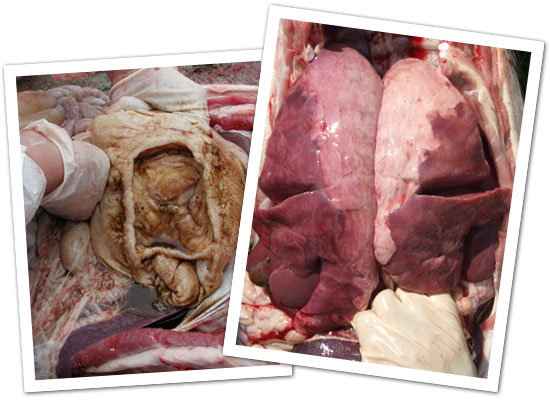
Based on necropsy of 812 pigs the following data was obtained:
336 (41.3%) pigs had ulcers/hyperkeratosis
600 (73.9%) pigs had pneumonia
290 (35.7%) pigs had ulcers/hyperkeratosis AND pneumonia
166 (20.4%) pigs had neither
This data is very confusing to decipher so to help it has been transformed into a 2X2 table (Table 2). So using the formula for OR then:
(290*166) 48.140
OR = ---------------- = ------------ = 3.38
(46*310) 14.260
Table 2. Relationship between pneumonia and ulcers or hyperkeratosis in 812 pigs.
| Ulcer / Hyperkeratosis | |||
| yes | no | ||
| Pneumonia | yes | 290 | 310 |
| no | 46 | 166 | |
This means that pigs are 3.38 (95% CI, 2.35 to 4.87) times more likely to have an ulcer/hyperkeratosis if they had pneumonia than those that do not have pneumonia. One can also say that pigs with pneumonia are 3.38 times more likely to have ulcers/hyperkeratosis. Because of the way OR are calculated, the association works both ways between pneumonia ⇔ ulcers/hyperkeratosis. Since our 95% CI (2.35 to 4.87) does not include the value of 1, we conclude that this OR is statistically significant (association is not likely to have occurred by chance alone). Now knowing that there is an association between pneumonia and ulcers/hyperkeratosis, we can feel good that it is possible to be able to have an impact. We can now spent the time and resources to do a study and see if implementing a vaccination program for respiratory pathogens could help decrease the incidence of stomach ulcers.
Gilts and piglet diarrhea
In this second case, a client had noticed an increase in diarrhea in 3 day old baby pigs. He was blaming a new source of gilts as having introduced a new pathogen into the farm. This was a 1,250 sow herd. On the day of the herd visit they reported 17 out of 58 litters (29.3%) had just broke with diarrhea. As you check the rooms with diarrhea you identify a lot of gilt litters do have diarrhea, but you also see several litters from older sows with diarrhea. You formulate your 2X2 table (Table 3) and calculate your OR = 14 (95% CI, 3.6 to 54.3). In this case, piglets with diarrhea are 14 times more likely to be from gilt litters than older sows and this is not just by chance (i.e. it is statistically significant). If the new gilts had brought in a new pathogen, it would be the piglets from the older sows that should be scouring as their mothers had not seen the pathogen before. You have strong evidence to support that in fact gilt litters are much more likely to be scouring and thus it is more likely that the gilts are being exposure to something new to them but likely already on the farm. Interventions can now be focused on gilts first rather than the whole herd.
Table 3. Relationship between piglet diarrhea and parity (gilts vs. other parity).
| Piglet diarrhea | |||
| yes | no | ||
| Gilt | yes | 12 | 6 |
| no | 5 | 35 | |
In summary, OR are a great field tool that can help quantify the strength of associations between two dichotomous variables. The stronger the association (meaning the greater the value for the OR) the more likely it will be that a change in one variable will actually affect the second variable. If you want to identify what impact the change will have, then you will need to demonstrate causation as well as calculate the attributable risk for each variable.
Click here to download an spreadsheet to calculate Odds ratios