


Every high quality research paper requires the reporting of statistical calculations. One of the statistical terms we focus a lot of attention is the P value. The P value is a statistic that provides us with the measured probability that a given outcome occurred by chance alone. In other words, it is used to tell us whether an outcome is STATISTICALLY significant or not. This is a valuable calculation, but it says nothing about the CLINICAL significance of the outcome. So how do we determine clinical significance? One way is to evaluate how many individuals need to be treated in order to obtain one more favorable outcome. This is the concept behind Number Needed to Treat (NNT). A NNT=1 means an intervention will produce a100% effect. That is that every individual treated will result in a positive outcome while every individual not treated would have a bad outcome. The formula for NNT is:
NNT = 1 / ARR
or
NNT = 1 / (EER - CER)

ARR = Absolute Risk Reduction (EER – CER)
EER = Experimental Event Rate
CER = Control Event Rate
To calculate NNT you need outcomes that are summarized as a proportion (i.e. a percentage). NNT can be easily calculated from many different studies if raw count or rate data is provided. Also, if the results are dichotomous (meaning they can be divided into two categories such as yes or no) then NNT can usually be calculated. You can even use special formulas or tables to convert an odds ratio (OR) to a NNT. A NNT cannot be calculated from case control studies because there is no incidence/prevalence statistics available.
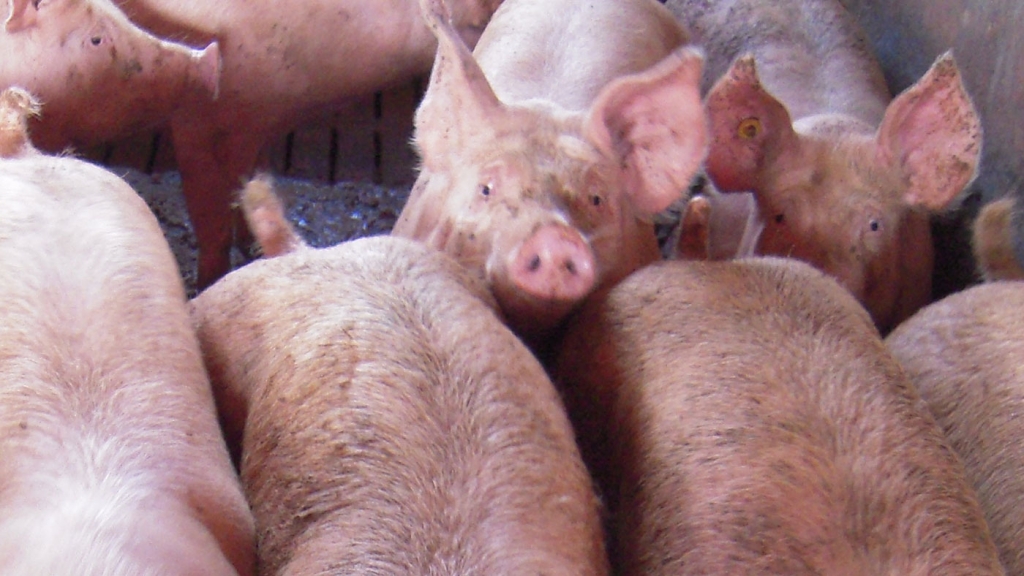
To better understand this concept let’s look at some examples from published data. The actual names of the products have been removed as the focus is on the concept and not the products.
|
Example #1.
In a field trial involving 533 pigs during a severe acute respiratory outbreak, the percentage of cured pigs was statistically significantly higher (P=0.0214) when using Antibiotic A (189/266, 71.05%) compared to the saline control group (124/267, 46.44%). The ARR = 0.7105 – 0.4644 = 0.2461. In other words, there was a 24.61% difference in cure rates between Antibiotic A and saline treated pigs in this trial. In this case NNT = 4 (1 / 0.2461) implying that you need to treat 4 pigs with Antibiotic A to obtain one more cured pig than if you just injecting with saline. Pigs were enrolled if they had a respiration score >1 (on a scale of 0 to 3 where 0 is normal), and/or an attitude score >1 (on a scale of 0 to 3 where 0 is normal), and a rectal temperature of ≥ 104°F (40°C). Pigs meeting enrollment criteria were randomly allocated to treatment groups and treated on Day 0. “Cured” was defined as on day 7 post-treatment a pig having being alive with a rectal temperature < 104ºF(40°C) and having a normal respiratory rate as well as not being depressed. |
|
Example #2. A total of 762 commercial feeder pigs in 10 studies from farms having previous histories of swine respiratory disease outbreaks were enrolled. A respiratory outbreak was defined as the day (Day 0) when at least 15% of study candidates in a pen had a respiratory score ≥ 2 (on a scale of 0 to 3 where 0 is normal), a depression score ≥ 2 (on a scale of 0 to 3 where 0 is normal), and a rectal temperature of ≥ 104°F(40°C). When the pen met the 15% outbreak threshold, the remaining pigs in the pen were assigned to treatment groups and treated with Antibiotic B or saline. A pig was classified as a treatment success on Day 7 if it was alive and had a respiratory score ≤ 1, a depression score ≤ 1, and a rectal temperature of < 104°F(40°C). In this study, Antibiotic B had a statistically significantly higher (P=0.0188) success rate (198/346, 57.22%) compared to those treated with saline (148/347, 42.65%). The ARR = 0.5722 – 0.4265 = 0.1457 or an 14.57% difference in cure rates between Antibiotic B and saline treated pigs in this trial. In this case NNT = 7 (rounding up 1 / 0.1457) implying that you need to treat 7 pigs with Antibiotic B to obtain one more successfully outcome than if you just injecting saline. |
|
Example #3. A total of 280 10-week old commercial pigs were enrolled from one site having a history of pleuropneumonia. When a respiratory disease outbreak appeared imminent, respiratory and attitude scores were recorded and rectal temperatures were taken. A pig with a rectal temperature of ≥ 104.0 ºF (40°C), increased respiratory rate, labored or dyspneic breathing, and depressed attitude was considered sick and febrile. When at least three pigs in a pen were sick and febrile, the pen was enrolled in the study. A pig was considered a treatment success if it had a rectal temperature of < 104.0ºF (40°C), normal respiratory character, and no or mild depression on Day 4. Morbidity was significantly lower (P<0.0001) in the group treated with Antibiotic C (10/137, 7.30%) than those treated with saline (71/138, 51.45%). Mortality was also significantly lower (P=0.0325) in pigs treated with Antibiotic C (0/137, 0%) compared to saline (9/138, 6.52%). The morbidity ARR = 0.5145 – 0.0730 or 0.4415 and mortality ARR = 0.0652 – 0 or 0.0652. In this study then, the morbidity NNT = 3 (rounding up 1 / 0.4415) and mortality NNT = 16 (rounding up 1 / 0.0652). This suggest that one would only need to treat 3 pigs to obtain one less sick pig (morbidity) while needing to treat 16 pigs to save one more pig (mortality). |
The results from many studies may initially seem shocking. Yes in fact some pigs do recover from disease regardless of what treatment is selected and, even with the best treatments, not all pigs will have the desired outcome. Respiratory disease in the field is not just due to a single bacterial pathogen, but rather many times it is complicated by other pathogens(especially viral ones), environmental factors (temperature, humidity), and the pig’s immune system (which is the main mechanism to fight off disease). Even if antibiotics were 100% effective, they require early identification and treatment of pigs to be successful.
Like all statistical values it is helpful to have a confidence interval (CI) for NNT. The formula for calculating the 95% CI can be complex depending on the type of data you have available. You can find some programs that will calculate this value for you on the web. Do remember though that having the CI will help you better put in perspective the expected range needed for one more favorable outcome.
The University of Oxford’s Bandolier publication on Evidence Based Medicine suggests that in human medicine NNT for very effective treatments usually range between 2 and 4, whereas useful prophylactic measures can have larger NNT. Preventive measures usually involve situations where very few patients may become affected in large populations. Currently there are no guidelines regarding suggested NNT values for veterinary medicine for either treatment or prevention.
Another advantage of NNT is that it allows one to calculate the economic impact of an intervention. Knowing the price difference between the two interventions as well as the ARR you can then calculate how much you need to spend in order to save one more pig.
Example:
Product A costs $2.50 per pig.
Product B costs $1.00 per pig.
ARR = 17% in favor of Product A
NNT = 6
So this would mean that one needs to treat 6 animals with Product A in order to save one more pig compared to Product B. It would cost $9.00 more to treat 6 pigs with Product A compared to Product B [6 * ($2.50 – $1.00)] but the result would be one more pig alive. This calculation assumes you would end up spending at least $1.00 on each pig (base treatment).
Remember that NNT are based on specific outcomes with specific time frames associated with them. This means that one must be VERY CAREFUL to compare treatments across different studies unless you know you are comparing like-for-like studies.
In summary, NNT is a simple tool that can be use in every day swine practice. It is an easy way to explain statistical as well as clinical significance of new interventions. It can also simplify the calculations of cost benefits of different interventions for our clients.
|
Side Note:
Key points regarding NNT:
|
