

All of you are familiar with the pressure that the swine production industry has come under related to nutrient management and now, its alleged impact on climate. We have largely depended on technological advances in genetics and nutrition to make efficiency gains to reduce these impacts but soon an entire set of management tools using farm data may become available to assist in extracting additional gains.
We all readily recognize that much more is going on inside your barns which affects profitability and resource use than you are currently able to evaluate with the typical farm software metrics like ADG and FCR. In some cases, the information which is glossed over in the typical averaged values of these metrics, if discovered early, could greatly assist in your ability to both diagnose key profit reducers (discover what they are) and to see near term future profit reductions coming, which could then be avoided. The key problem is that much of the profit reduction (lost opportunity) is caused by a subset (often relatively small) of the total barn population. We refer to these as subpopulations within the barn.

Subpopulations are essentially any defined subgroup of pigs within a larger population. Say you have a theory that a large percent of piglets which are below the average litter weight at birth and are born to parity three and lower sows are subject to a higher percentage of vaccine failure when vaccinated at the typical time of processing with all the other piglets. In addition, what if you could identify them and vaccinate them a day or two later and fully restore their vaccination efficacy?
Here we have multiple subpopulations including lower than litter-average weight, born to parity three and down females, vaccinated on a certain range of days after farrowing, etc. At the present, commercial barns could probably identify these animals in the farrowing house but how difficult, costly and unlikely would it be to track these animals throughout production to measure their outcome and if it has enough profit impact, to justify action to prevent loss?
Subpopulations are often defined as a weight range, say everything in the barn between 30-50 kg. Or they can be defined as all animals which have a common characteristic, such as our below litter-average weight at birth. In the second case, the distribution of these animals’ weights will be mixed in with other animals which do not possess the group’s definition. Teasing them out with only slaughter data can be challenging for sure and when it can be done requires sophisticated software. One of the complicated factors in working with subpopulations like this is to both identify the individuals and then take periodic measurements as they grow so that the economic impact of the effect can be assessed. While this is sometimes done in barns equipped for conducting experiments, it is usually too difficult and labor intensive to do under commercial conditions.
All of this is changing and the ability to define a subpopulation and then to track it through your data cost effectively will be with us soon. As I suspect you know, there are quite a few people working on ways to identify animals and take measurements on them passively, while they are growing, without disturbing the group by segregating animals to a scale or otherwise handling them. Once you interact with the group in a significant way, like entering pens and weighing them multiple times, you run the risk of affecting the outcome of the entire group negatively by stressing the animals.
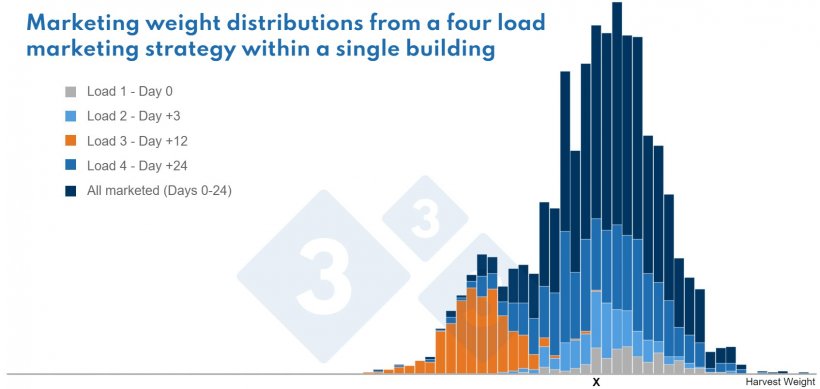
Notice the graph. The dark blue bars represent all animals marketed and the other colors are subpopulations marketed at different numbers of days on feed. Notice the X placed on the weight axis. The animals weighing “X” can clearly be seen to come from 4 different subpopulations (trace straight up from the X by color). If we did not add the additional information about date of marketing, only the dark blue colored bars (all animals) would be available. This illustrates the information deficit which can result from too much “averaging” or consolidation of characteristics. Next time we will take a look at how dividing your data by clusters of characteristics into subpopulations can help diagnose problems and develop action plans.


