

Variability is inherent to any biological process. However, the market demands homogenous pork products. Satisfying this demand is problematic when marketing live pigs: preparation of pig loads, multiple day loads, various fasting periods, several weeks to empty a farm, etc. All costly practices that are not always easy to quantify financially. As a result, it could be said that variability within the farm has a hidden cost.
In recent years, this problem has increased. At the final stage of the process (higher demand for a homogenous final product) and also at the initial stage (higher prolificacy in sows that results in a higher dispersion of piglet birth weight). Since this is a costly and growing problem, we should be able to analyze it and propose possible solutions.

The first challenge is to measure the live weight variability within the farm. It is not easy to have databases that include the individual weight of all pigs at different ages, for different genetic lines, production schemes and health status. When variability is known, we should identify the causing factors and how we can manage them so we can increase homogeneity, or at least prevent generating more variation.
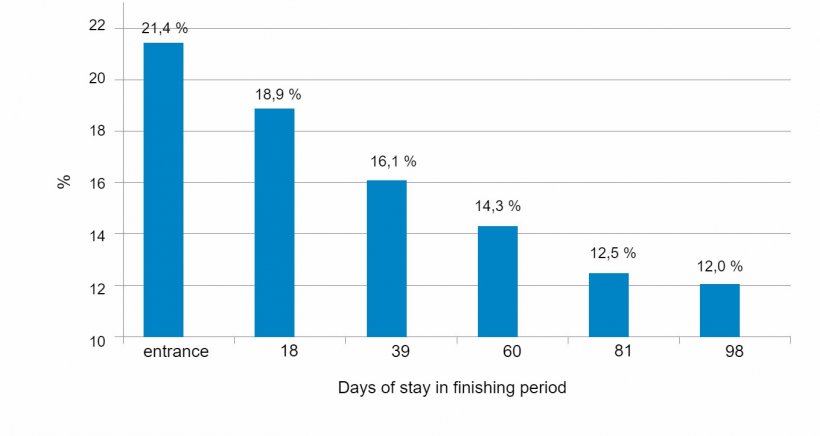
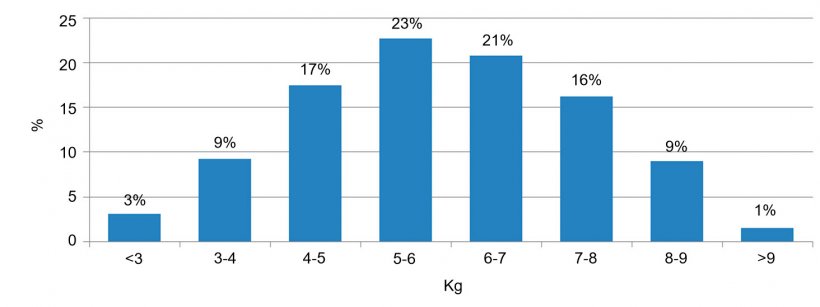
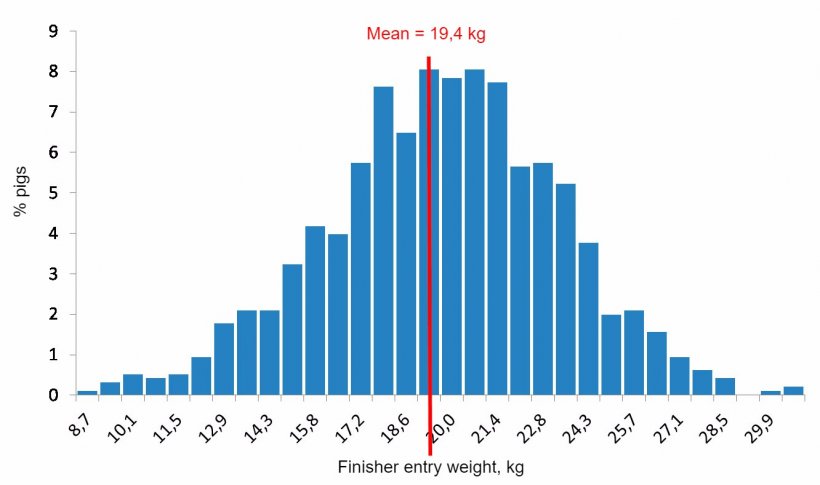
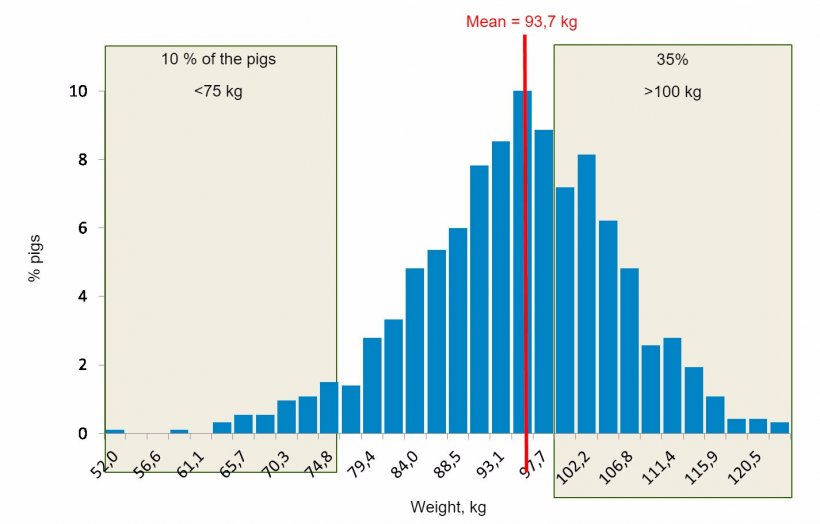
In the following graphics we show examples of weight dispersion at different stages of production. As shown, the standard deviation increases with age. When dividing it by the mean, we get the coefficient of variation that inversely decreases with time (Figure 1). However, the weight ranges increase considerably (Figure 2).
The final weight distribution at the end of the finishing period is the sum of multiple factors. Some of the factors cannot be changed by the producer. Changing others may carry associated costs that are unacceptable. Part of the variation is congenital; associated to a specific dam and sire line genetic traits. The sow prolificacy, low birth weight, parity number, colostrum intake, the milk production capacity, and the lactation length, will affect weight variation at weaning. After weaning, deficiencies in pen density, feeder space, number of drinkers, health status, environmental comfort, etc. can contribute to an increased variability during the growing phase. Recent studies show that the variability of weights at weaning only explains around 50% of the weight variability at slaughtering; whereas birth weight only explains 10%. Therefore, there is room to maneuver, especially in specific moments (windows of opportunity) of the production cycle. Those are (1) the first days after birth, (2) the first weeks post-weaning, and (3) during the first month in the growing-finishing stage.
In practical conditions, there are very different pigs in the same farm at the same time, with important differences in body weight, in daily feed intake (ADFI) and in daily growth (ADG) potential. Accordingly, there are significant differences in cost of production. If we could measure it individually, we would realize that some of the animals are hardly viable from an economic point of view.
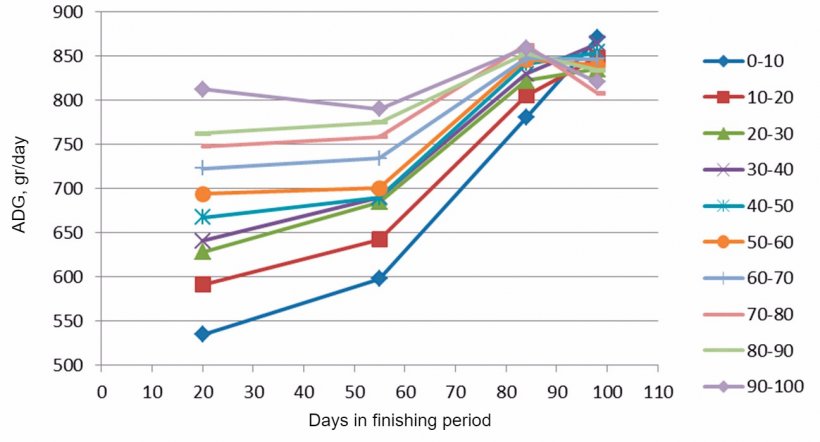
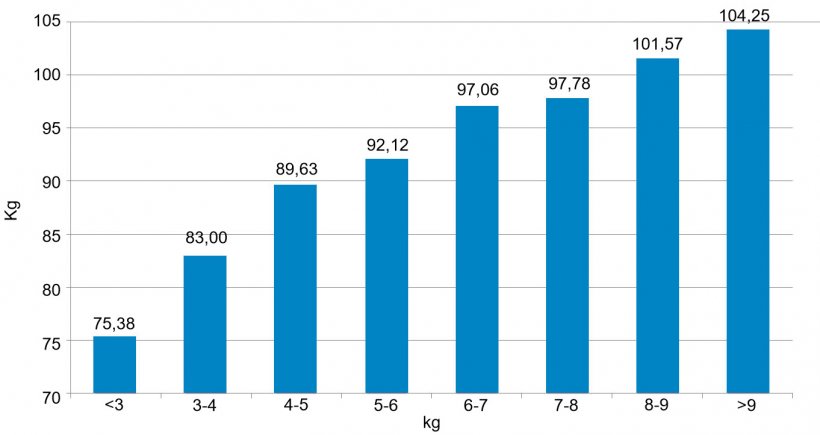
Figure 7 shows the ADG for each farm percentile according to their initial weights. The two highest percentiles have double ADG than the two lowest ones. At slaughter, carcasses from pigs with lower ADG are much leaner than those with higher ADG. As a result, the intra-farm variability can be equal or higher than the variability between farms or even higher than the average differences between sexes or between genetic lines. There are many studies on the difference of requirements by sex, especially non-castrated versus castrated males, and also non-castrated males versus females. Also, it is well known that diverse genetic lines have different nutrient requirements. Lean pigs as Pietrain have a higher lysine:energy requirement than other genetic lines with greater ADFI, greater ADG and lower lean growth potential, such as Duroc or other similar synthetic lines. However, within the same farm, we feed the same diets to the two highest percentiles and also the two lowest percentiles, when it is obvious that they are animals with very important differences in ADG, ADFI and body composition.
Therefore, answering the initial question, do we know how to feed an heterogeneous population of pigs? The answer is no.
Nowadays, we know how to feed the average pig of a certain genetic composition, and sex, once we have characterized the ADG and ADFI, protein and fat composition. We use this information to estimate the requirements (ratio lysine:energy) for each productive phase through mathematical modelling. In order to challenge the usual practice, we could state that the higher fine-tuning of feeding the average animal, higher generation of variability. Higher fine-tuning means multiple phases with a budget (kg of each feed) per animal. To reduce the final weight variability, it is clear that the best strategy would be to maximize the ADG of the lower percentiles. However, in a multiple phase feeding, when we change to a feed with a lower lysine:energy ratio, the lightest pigs have not consumed the budgeted amount of the previous feed. Therefore, we may be underfeeding them for most of their productive life and limiting their genetic potential which is already inferior compared to the fast growers of the farm.
The optimal solution to this problem is the well-known “precision feeding”. However, this technology is not currently available at the commercial level, possibly due to the complexity, technological robustness and cost of the investment. Time will tell whether applicable solutions at a production farm level will show up. In the meantime, it could be advisable to measure the intra-farm variability that we have in our systems; to estimate how different the feeding programs would be if we could feed differently fast growers vs slow growers, and design strategies to apply this to commercial farm conditions, in a practical way from both a logistical and operational point of view.
Let me conclude with a provocative statement: since we do not really know the cost of variability, we also do not know how much money could be saved if we could minimize it. Perhaps the savings would surprise us!
