

Production of pig meat worldwide exceeds that of any other meat. Traditionally, linear programming is used to generate minimum cost diets that to meet the pig nutrient requirements. Of greater importance to the pig producer than least cost diets is the maximisation of gross margin (per pig place or per pig place per year). Computer pig growth simulation models are now used commercially to evaluate the profitability of different feeding strategies. However, for a given farm, the number of diets fed, their energy content (d), amino acid content (using lysine as a proxy, r), the quantity fed (p) and the length of time a diet is fed (t) can vary, thus giving a very large number of possible feeding strategies (F, as many as 1050). Adding nonlinear optimisation methods to a growth model allows an F to be found that yield the maximum for a given objective function (OF). A computer simulation program has been developed which links a linear program for least-cost diet formulation, a stochastic pig growth model and a genetic algorithm (GA) to find the best feeding strategy (Figure 1, from Morel et al, 2010).
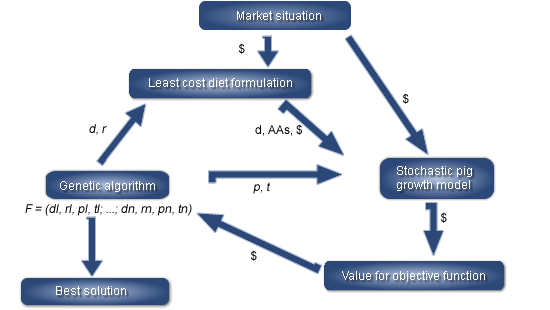

Figure 1: Overview of the simulation program linking a linear program for least-cost diet formulation, a stochastic pig growth model and a genetic algorithm (GA) to findthe best feeding strategy (F) for a given objective function in a specific market situation (dietary content: d = energy, r = lysine, AA = amino acid and protein; p = feeding intensity; t = length of feeding a diet)
In the stochastic pig growth model, pig genotype is characterised by the maximal protein deposition potential (Pdmax), minimum lipid to protein ratio (MinLP) and the energy intake potential (p). Variances and covariances of these quantities are used to grow a population of pigs instead of a single pig.
A feeding strategy is a finite set of feeding periods, F = (d1, r1, p1, t1; d2, r2, p2, t2;…; dn, rn, pn, tn), where each feeding period consists of a quadruple of factors that influence the feeding strategy (d, r, p, t). The objective function (OF) to be maximised is usually the gross margin per pig or per pig place and year.
In pig production systems, feed composition plays an important role in the production of Green House Gas (GHG) through methane and nitrous oxide emissions. Currently, when diets are formulated no consideration is given to reduce GHG. The excretion of volatile solids (VS) is the principal source of methane emissions from pigs, through manure handling systems. The concentration of excreted nitrogen (Nex) within the manure will depend upon how well the dietary protein matches the animal’s nutritional requirements for growth. Both VS and Nex can be simulated in the growth model, converted to CO2-equivalents for different manure disposal systems (eg aerobic lagoon or deep litter systems) and incorporated in the Objective function with gross margin (GM).
OF = a x GM + b x Nex + c x VS
Varying the weighing factors (a,b,c) allows more or less emphasis on profitability or environmental impact when searching for a best feeding strategy. The factors b and c can also represent the CO2-equivalent cost ($) associated with both Nex and VS excretions.
In April 2011, a computer simulation was carried out using current New Zealand feed cost and price schedules. Growth from a 20 kg liveweight to a 70 kg carcass weight was simulated for two pig genotypes varying in their minimal lipid to protein ratio (minLP) and maximum protein deposition potential (PDmax; g/d): normal (0.75;160) and lean (0.6;200). The a value for gross margin in the objective function was always set to 1, the b value for Nex and the c value for VS was set to 0,1,10,100,1000 and 10000 to find the minimal possible values for Nex and VS . The values of b and c were also set to represent the possible $CO2 cost due to Nex and VS. Each genotype x OF combination was run 10 times. The GA had a population size of 20 feeding strategies and the search was stopped when the objective function had not improved for 10 iterations. Some results of this simulation study are briefly presented below.
The gross margin per pig, volatile solids excretion and excreted nitrogen for normal and lean pig genotype with feeding strategies optimised to reduce either Nex or VS excretion are presented in Figures 2 (a) and 2 (b), respectively. Overall, the lean genotype had higher gross margin, less nitrogen and less volatile solid excretion rates than the normal genotype. For both genotypes Nex can be reduced by up to 15 to 20% without reducing profitability.
Figure 2: Gross margin per pig (![]() ), volatile solid (Δ) and nitrogen (O) excretions for a normal (empty symbol) and lean pig (full symbol) genotype when the feeding strategy is optimised to reduce either nitrogen excretion (a) or volatile solid excretion (b).
), volatile solid (Δ) and nitrogen (O) excretions for a normal (empty symbol) and lean pig (full symbol) genotype when the feeding strategy is optimised to reduce either nitrogen excretion (a) or volatile solid excretion (b).
However, this reduction in Nex is associated with an increase in VS within the manure, thus no real reduction in the total CO2-equivalent produced is observed in an anaerobic lagoon or deep litter effluent treatment system (Figure 3).
Figure 3: CO2 equivalent and Gross margin per pig, for a normal (empty symbol) and lean pig (full symbol) genotype when the feeding strategy is optimised to reduce either volatile solid (Δ) or nitrogen excretion (O) with anaerobic lagoon (....) or deep litter (__) effluent systems
Computer simulation of growth is a useful mechanism that can be used to find specific feeding strategies which reduce GHG emissions and maximize profitability in growing pig herds while considering different manure treatment systems.