

 We have at our disposal more information than ever (Google processes more than 20 petabytes a day), although this abundance does not entail any guarantee of success. Having the information in the suitable moment is as fundamental as being able to connect data that apparently have no relationship between them.
But, how important is the information for attaining a competitive advantage? A report recently published (in 2011) by ‘The Economist Intelligence Unit’ and based on 602 surveys to company managers of different levels in all the world, gives us some clues: the majority of them agree about the best way of obtaining a competitive advantage, that entails obtaining the best information available, interpret it and share it out in formats that are easy to understand. But in practice very few companies are able to overcome this challenge, and the result is normally that there is a great amount of corporative information that remains unused. In fact, only the 17% of the companies use more than the 75% of the collected information and only the 27% of them think that they use it better than their competitors. So, the most common situation is that the companies swim in a sea of unused data and information.

Among the factors that contribute to this scenario are a bad organization, deficient exchange processes and too restrictive safety policies. In general, the big companies tend to lean more on internal information, whilst the smaller ones tend to lean on the external or the markets information. In any case, the three main attributes that the managers of this survey assigned to the information were precision, validity and detail level. It can be striking that the detail level is mentioned in the third place, but if we think that the decision making process is always subject to risks because the circumstances change continuously, many times it is better to make a quick decision based on the available information instead of waiting to have all the information that we would like to have (this is what is normally called fuzzy logic).
The majority of these situations can be applied to pig production. Many companies base their information management systems on different production software packages (that go from simple local packages, even tailor-made, to great systems with a high quality and prestige), and even Excel sheets with different complexity degrees. Very frequently the process is not very agile, the key indicators have not been defined and the priorities are not clear or, in other words, the data (or some of the data) are gathered, they are processed with management software packages or Excel sheets, generating worklists and routine reports that are more or less simple. Only when any problem arises or we suspect of a problem, the influence of other factors (parturition number, batch, seasonal effects, installations) is checked in the case of the sows, the piglets and the fattening stage. In fact, it is interesting (and contradictory) the many data that are taken down to try to deal with these problems and the little advantage that is normally taken from those notes or entries.

Finally, the industry, with its continuous evolution, needs new indicators that have not been routinely treated up to this date. In general, only the reproductive yields of the sows, and the production of weaner stage and fattening pigs have been managed. There is a growing need for the routine gathering of health data, including the sows during their pregnancy (% of lamenesses and their kind) and their lactation (presence of MMA), and the pigs in the weaner and the fattening stages.
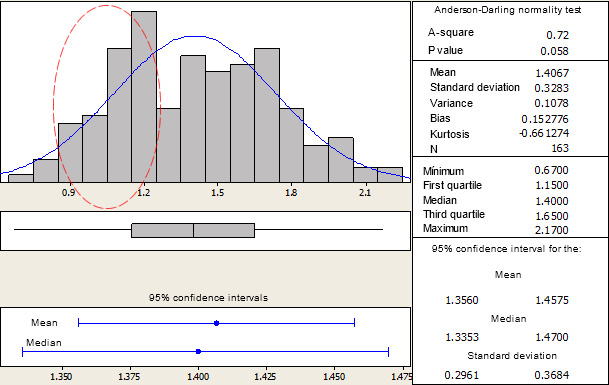
For instance, the prolificacy has been and is improving notably in the last years, affecting the weight at birth (Graph 1) and the homogeneity of the weights at weaning. These animals that reach the weaning stage but whose weights and viability are lower can affect remarkably the mortality in the weaner stage.
Graph 1. Example of the distribution of the weights at birth in hyperpolific sows
If we ignore this factor we can be mistaking the root of the problem. Another example can be that of the sows sent to the abattoir due to lamenesses, which is a growing problem after the housing of the pregnant sows in groups, as the new animal welfare regulations point out, and that is worsened in installations with an inadequate design or construction. The generic cause for elimination called "lameness" is clearly insufficient, bearing in mind the high number of causes that can bring about this symptom. Both examples must be adequately dealt with by the producers and the consultants when using the correct software packages and they must be used within an information management system.

