

Preliminary analysis of the data is interesting and, in some cases, very suggestive for veterinarians of the causes of these injuries: facilities, nutrition, fights, etc. Based on the percentage of injuries with one specific cause, technicians can know where the problem lies in that particular farm.
Data dump and subsequent analysis, which is done automatically, reveals trends that help forming a picture on the situation on the farm.

First of all, we noticed that, on average, more than 80% of the sows we examined had some kind of hoof injury of varying severity, usually located in their hind legs; this data matches previous research on the subject (Anil et al. 2007.)
The most common type of injuries are heel and secondary digits overgrowth (Figure 3), although it varies depending on the farm, as we can see in Figures 4 and 5.
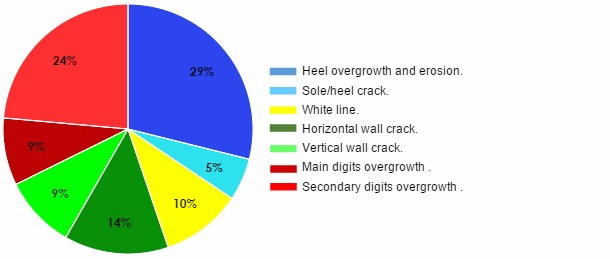
Figure 3. Distribution of the type of lesions contained in the database.
As noted above, Figures 4 and 5 show different farms with different % for types of lesions, clearly indicating their origin to the veterinarian.
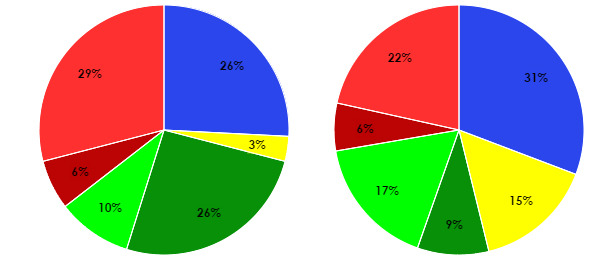
| Figure 4. Distribution of leg injuries in a given farm. The big percentage of cracks in the horizontal wall suggests the problem lies on the floors and pen design or density. | Figure 5. Distribution of leg injuries in a given farm with problems of cracks in the vertical wall and white line. An inspection of the farm is necessary to detect damp issues, uneven ground, fights and feeding problems. |
Although the fact that the older the sow, the higher the number of injuries might seem a more logical speculation, this first analysis reveals that the sows with the most hoof injuries, regardless of the type of injury, are the ones on their second farrowing. Figure 6 shows that, although there is variation between farms, this is a widespread fact.
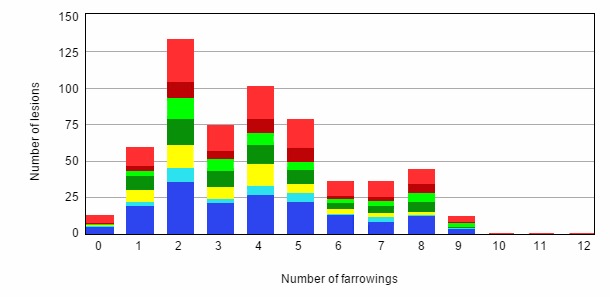
Figure 6. Distribution of injuries per number of farrowings.
Pending further increase on the volume of the database and the linkage of these results with production outcomes, we suspect this peak of lesions in such young sows may be another symptom of the second-litter syndrome, caused by the high metabolic stress experienced by sows during their first gestation/lactation. This stress induces a certain level of systemic sterile inflammations caused by the release of cytokines, which act readjusting metabolic pathways and prioritizing the status of apparent physiological emergency the animals are facing in detriment of their reproductive function (M. Wilson et al, 2010.) As a result, the sow's reproductive capacity decreases, and both data and farm findings reflect the famous "second-litter syndrome".
Another indicator being used to help understand how badly a farm is affected is the Early Detection Ratio. This data helps us check the severity of the actual lesions in relation to the total of lesions recorded. That is, if most of the lesions present in the farm are Grade 1, we can conclude they've been detected at an early stage, which means that either the prognosis is better or the problem is less serious.
The closer this ratio is to 1, the better the situation in the farm: the problem is less serious because the number of grade 1 lesions is higher that the number of grade 2 and grade 3 lesions. This number is 0.42 in the whole of the database, so it can be concluded that, so far, most injuries have a certain degree of severity. This figure varies between farms, from 0.7 in some of them to values close to 0.2 in others, with lameness problems usually already suspected or confirmed in the latter.
In conclusion, we can ensure that the number of sows affected by some type of injury or lameness in our farms is much higher than it initially appeared to be. In addition, these data need to be linked to reproductive data in order to determine how exactly these non-diagnosed problems influence unspecific reproductive issues, low production or low sow retention rates.
And finally, we must determine the extent of the economical impact on our farms and the return on investment that remodelling or changing facilities involves, together with the cost of feeding systems, protective high quality nutrition, etc. these lesions cause/promote.