

Last time we began to analyze the use of the feed conversion ratio (FCR) as a means to understand the efficiency of a pig farm in turning the basic and most costly farm input into valuable pork for the consumer. There are a lot of “truisms” about FCR which aren’t really true and ways in which it is used to make financial decisions which are not sound. Let’s take a look at some of these and then reveal what is really going on behind the FCR number most producers measure at the close-out of a finishing group.
We mentioned that in the United States, a recent survey of producers revealed that only 17% measure the FCR on a carcass basis. This can be deceptive when like most producers in the United States, you employ feed ingredients that change the carcass yield. The use of ethanol byproducts like dried distillers grain with solubles (DDGS) can change the carcass weight as a percent of the live weight by up to 1.5% or more depending on the finished weight. Closeout FCR on the live weight of the animals will tend to show very little change when DDGS are utilized compared to a diet without DDGS but this difference in carcass percent is fully represented in the carcass FCR.

Beyond the engineering or pure efficiency measurement of FCR, we can place a monetary value on either the numerator or the denominator (or both) and change the FCR from a purely physical measurement to a financial metric. The most common one used in the United States is a cost focused metric feed cost per pound (kg) gain (or of pork sold). By making the switch to a financial ratio, such as this, you can estimate the cost (cost savings) of a change which affects the FCR. Some of the things which impact FCR include genetics, stocking density, pelleted vs mash feeds, finished weight, mortality, the number of diet phases employed, season of the year and the nutritional composition of the diet (for instance the level of fat used). A change in any of these production parameters is likely to change the FCR. The thing to keep in mind is that it is often difficult to hold everything else constant except FCR when any of these changes occur, so the financial change in FCR is only part of the full analysis.
We continue to stress that financial decisions, when properly undertaken, are most often multi-period analyses. So if you are listening to a salesman telling you how much their new feeders will improve your feed efficiency (FCR), you would be very naïve to plug in today’s cost of feed in deciding what the savings would be to offset the feeder’s cost. In fact, if you would expect the feeder to last for 10 years, you might consider using the 10 year average of feed costs in your calculation since the current cost could be unusually high (making the feeders look like a very good deal) or unusually low, leading you to pass on an investment that over their useful life could be very cost effective.
If you have been following our approach over the last year, you know that even the average can be deceptive when prices are highly volatile like the last 15 years. As an example, corn is the principal feed ingredient in pig diets in the United States and will therefore be by far, the biggest share of the diet cost in the wean-to-finish phase. We have demonstrated in the past, the underlying processes generating corn price levels have changed many times over the last ten years. Take a look at Figure 1, the actual frequency distribution of the national average corn price in the United States for the last 10 years. You will see that it seems to have several distributions (reflective of changing processes) blurred together and is clearly multi-modal (the most likely price is not the mean). What you might find especially interesting and I hope you remember this every time you use an average in a quick calculation, is the average price of corn during this period was $4.12/bu (about $161.86/Mton) as pointed out by the red arrow in Figure 1. Now notice the height of the blue bars (which is a measure of how frequently a given price was actually observed to occur). What you will note is that if you used $4.12 in your calculations, you would very, very rarely expect to get the outcome you calculated on any given day and there may be long periods of time when the outcome of your calculations was not achieved. Yes, in the long-run you might average this outcome but by then, the bank may have come to take back your feeders. (“We are all dead in the long run.”—John Maynard Keynes).
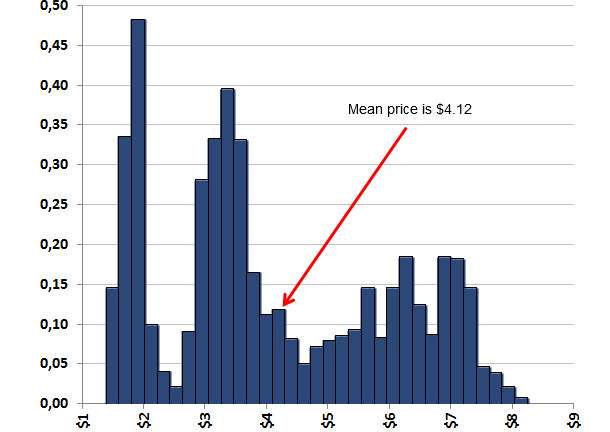
Figure 1. Corn Price Distribution March 2004-March 2014
You will hear many consultants talk about the value of a “point” (hundredth) or a tenth change in FCR in terms of cost savings. Most are using current feed ingredient costs to make that calculation. In Figure 2, we demonstrate the value of changing FCR a tenth, from 2.70 to 2.60 over 220lbs (100kg) of grow-finish gain using the price distributions of the key feed ingredients in grow-finish diets for the last 4 years. You will notice it is a distribution, not a single value, ranging from $3.65/head during high feed cost periods to $1.18/head during low cost times. The height of the bars reflects how likely (compared to the others) you would be to realize the value under the bar on the axis. So the next time you hear someone over lunch tell you the value of a tenth improvement in FCR, unless they are drawing a distribution on your napkin, tell them you don’t run an average pig business so you are not interested in their average values.
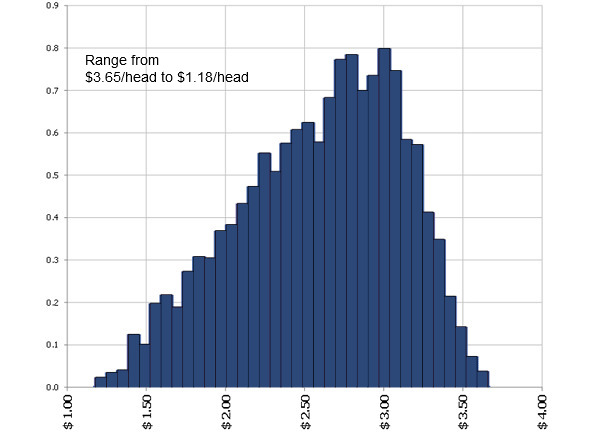
Figure 2. Distribution of feed costs savings: the value of 2.60 vs 2.70 in 220 lbs grow finish gain. March 2010-March 2014.
