


Barley (Hordeum vulgare) is a monocotyledonous herbaceous plant with an annual growth cycle included in the Gramineae family. It has a great adaptability to different soils and climate zones. In the past, six-row barley was used to feed animals, and two-row barley (malting barley) to produce beer, but currently, six-row barley production has dropped in favour of two-row barley, because it can be used in the beer and malting industry as well as to feed animals.

The grain contains some 3.8% of germ, 18.1% of bran (pericarp and testa) and 78.1% of endosperm (including aleurone). Barley contains relatively high levels of protein and minerals in comparison with other cereals such as maize and sorghum, and a low fat content. Barley grain has a sugar content of 1.5-2.5%, mainly as soluble sugars (sucrose and raffinose), but it basically differs from the rest of the most used cereals in pig feeding because of its content in barely lignified fibre, that can double that of maize, sorghum, wheat or rye (it is more similar to oats). The differential trait of barley fibre is that most of it is comprised of ß-glucans and pentosanes, that vary depending on the climate and the crop conditions. In fact, its energy value (ME/kg) is lower than that of wheat and maize.
Production and trade
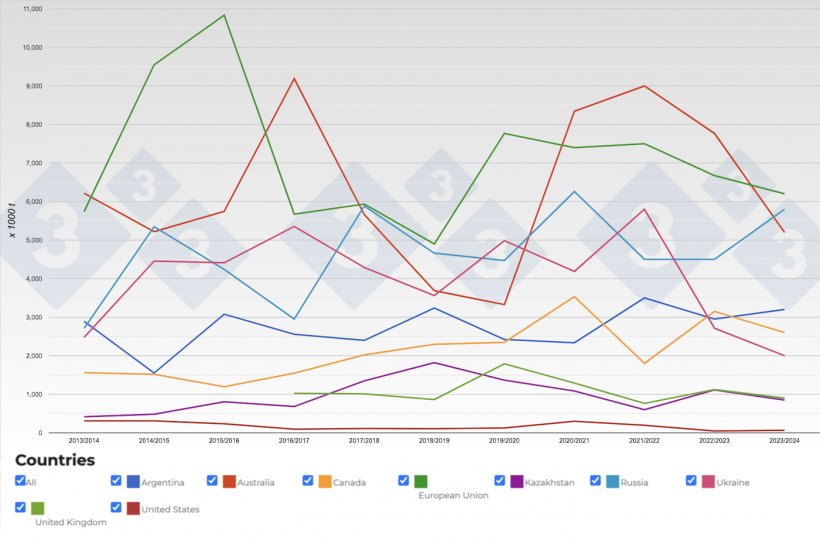
Production
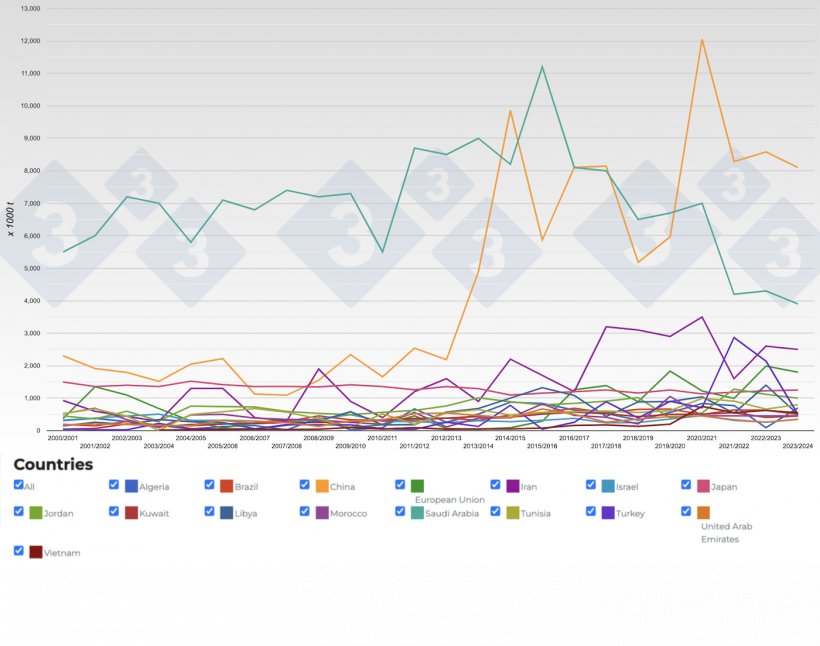
Trade
Comparative study of the nutritional values
The systems used in the comparison are: FEDNA (Spain), CVB (The Netherlands), INRA (France), NRC (USA) and Brazilian.
| FEDNA | CVB | INRA | NRC | Brazil | |
| DM (%) | 88.9-89.9 | 86.7 | 86.7 | 89.9 | 87.1 |
| Energy value (kcal/kg) | |||||
| Crude protein (%) | 9.6-11.3 | 10 | 10.1 | 11.33 | 10.8 |
| Ether extract (%) | 1.7 | 1.8 | 1.8 | 2.11 | 1.7 |
| Crude fibre (%) | 4.7 | 4.3 | 4.6 | 3.9 | 4.25 |
| Starch (%) | 52.5-51.9 | 52.8-54.0 | 52.2 | 50.21 | 52.1 |
| Sugars (%) | 1.6 | 2.3 | 2.1 | - | - |
| DE growing pigs | 3,3151-3,3702 | - | 3,070 | 3,150 | 3,106 |
| ME growing pigs | 3,2301-3,2702 | - | 2,970 | 3,073 | 3,019 |
| NE growing pigs | 2,3251-2,3452 | 2,390 | 2,280 | 2,327 | 2,305 |
| NE sows | 2,3751-2,3952 | 2,390 | 2,320 | 2,327 | 2,380 |
| Protein value | |||||
| Crude protein digestibility (%) | 78 | 74 | 75 | 79 | 79.5 |
| Amino acid composition (% CP) | |||||
| Lys | 3.6 | 3.6 | 3.8 | 4.5 | 3.8 |
| Met | 1.64 | 1.7 | 1.7 | 2.3 | 1.67 |
| Met + Cys | 3.83 | 3.9 | 4 | 5.2 | 4.07 |
| Tre | 3.31 | 3.4 | 3.4 | 4.1 | 3.33 |
| Trp | 1.2 | 1.2 | 1.2 | 1.5 | 1.2 |
| Ile | 3.5 | 3.5 | 3.6 | 4.2 | 3.33 |
| Val | 4.9 | 4.9 | 5.1 | 5.9 | 4.44 |
| Arg | 4.91 | 4.9 | 4.8 | 6.0 | 4.91 |
| Standardised ileal digestibility (% CP) | |||||
| Lys | 78 | 76 | 75 | 75 | 73.7 |
| Met | 84 | 82 | 84 | 82 | 82 |
| Met + Cys | 82 | 80 | 84 | 81 | 82 |
| Tre | 79 | 79 | 75 | 76 | 74.3 |
| Trp | 80 | 77 | 79 | 82 | 76.9 |
| Ile | 81 | 82 | 81 | 79 | 80.6 |
| Val | 80 | 80 | 80 | 80 | 78.9 |
| Arg | 83 | 84 | 83 | 85 | 83.3 |
| Minerale (%) | |||||
| Ca | 0.06 | 0.05 | 0.07 | 0.06 | 0.05 |
| P | 0.32 | 0.31 | 0.34 | 0.35 | 0.35 |
| Phytic P | 0.21 | 0.23 | 0.187 | 0.22 | 0.2 |
| Available P | 0.11 | - | - | - | 0.15 |
| Digestible P | 0.10 | 0.11 | 0.11 | 0.158 | - |
| Na | 0.02 | 0.01 | 0.01 | 0.02 | 0.02 |
| Cl | 0.12 | 0.1 | 0.11 | 0.12 | 0.12 |
| K | 0.4 | 0.49 | 0.48 | 0.38 | 0.43 |
| Mg | 0.1 | 0.12 | 0.11 | 0.14 | 0.13 |
1Spanish two-row barley with a crude protein content of 9.6%.
2Spanish two-row barley with a crude protein content of 11.3%.
As opposed to the rest of the tables, the FEDNA clearly differentiates between two barleys with a different quality classified according to their protein content, whilst the CVB, INRA and Brazil only consider a single barley quality with intermediate values (10.0-10.8%), except the NRC, that equates to the FEDNA's higher range as its single protein value (11.3%). This is closely related to the fact that the NRC offers the lowest fibre value, followed by Brazil, the INRA and the CVB, with a very marked negative correlation (r2 = -0,83) between the protein and fibre contents (with the exception of high-protein barley for FEDNA, that assumes a fixed value for fibre content). The same correlation, although less marked (r2 = 0,56) is seen between the protein and starch contents.
These relationships have a direct impact on the net energy (NE) estimated value, because the clear positive correlation between starch content and NE is evident (with the exception of the INRA, with a downward NE estimation for high starch values in comparison with the rest of the estimation systems). We must highlight that, as opposed to the rest of the estimation systems, the NRC gives barley higher protein values (+15% with respect to the FEDNA's low-protein barley and the same value as the high-protein barley), higher fat values (+20%), but lower fibre values (-20%), barley being a fibrous cereal. Regarding the energy value, both the INRA and the NRC, estimate that NE is 2-3% lower than for the FEDNA, whilst Brazil and the CVB's values are only slightly higher (+0.2% and +0.5%).
In terms of total amino acids, and taking as a reference lysine, we can see that whilst the FEDNA and the CVB offer similar values, the INRA and Brazil show an increase by 5% in lysine content. The NRC's case is more extreme, as it shows a 20% higher lysine value. The values for the rest of the amino acids are quite proportional with respect to lysine. Lysine digestibility coefficient shows a range that goes from 74% (Brasil) to 78% (FEDNA), with intermediate values (75-76%) for the rest of the estimation systems (CVB, INRA and NRC). Exceptionally, the INRA shows higher digestibility values for sulphur amino acids, and the NRC offers a higher digestibility coefficient for tryptophan.
Recent findings
- Comparative energy content and amino acid digestibility of barley obtained from diverse sources fed to growing pigs.
Differences in the chemical composition, metabolisable energy content and the SID and AID of AA were observed among barley sources obtained from Australia, France or Canada. The feeding value of barley from Canada and Australia was higher than barley obtained from France that is important information in developing feeding systems for growing pigs where imported grains are used. - Apparent and standardized ileal digestibility of amino acids in diverse barley cultivars fed to growing pigs.
Differences in the ileal digestibility of crude protein and AAs among barley varieties is observed but, it is difficult to predict the standardized ileal digestibility of most of the amino acids in barely based upon chemical characteristics - Determination and prediction of the digestible and metabolisable energy content of barley for growing pigs based on chemical composition.
The DE and ME contents in barley grains of different origin can be predicted with an acceptable accuracy by regression equations when used as feed for growing pigs. - Partial dehulling increases the energy content and nutrient digestibility of barley in growing pigs.
The DE and ME contents as well as the apparent total tract digestibility of nutrients in dehulled high fiber barley and dehulled low fiber barley are improved compared with the high fiber barley and low fiber barley. Moreover, the nutritive value of dehulled low fiber barley is comparable to the yellow-dent corn. - Standardized ileal digestibility of amino acids in eight genotypes of barley fed to growing pigs.
A comprehensive database on chemical composition and SID of CP and AA in eight current barley genotypes has been made available from this work. However, as present SID values are lower compared to feed tables, adjustments are required to minimize the risk of overestimating the actual protein value of barley for pigs. - Determination of basal ileal endogenous losses and standardized ileal digestibility of amino acids in barley fed to growing pigs.
For low-protein feed ingredients like barley the regression method may be preferred over correction of apparent ileal digestible values for their ileal endogenous amino acid losses determined under N-free feeding conditions, as intercepts and slopes of the linear regression equations between apparent ileal digestible content and total dietary crude protien and AA provide direct estimates of ileal endogenous amino acid losses and standardized ileal digestibility of crude protein and AA. - Hulled and hull-less barley grains with the genetic trait for low-phytic acid increased the apparent total-tract digestibility of phosphorus and calcium in diets for young swine.
The LPA mutant 955 (M955) genetic trait was effective in hulled and hull-less barley in isocaloric diets fed to young pigs. Pigs fed the diet with LPA M955 consumed 31% less P and excreted 78% less fecal P and 30% less fecal Ca than pigs fed the diet with NB + inorganic P that was equal to diet M955 in available P. Therefore, LPA barley, especially M955 with 95% available P, will reduce the use of inorganic P in swine diets, reduce P pollution from swine manure, and support the goal of achieving global P sustainability. - Extrusion of barley and oat influence the fecal microbiota and SCFA profile of growing pigs.
The effect of extrusion of barley and oat on the fecal microbiota and the formation of SCFA was evaluated using growing pigs as model system. Cereal extrusion affects the microbiota composition and diversity towards a state generally thought to be less beneficial for health, as well as less amounts of beneficial butyric acid. - Wheat and barley differently affect porcine intestinal microbiota.
Wheat and barley differently influence microbial composition particularly in the small intestine, with barley increasing the Lactobacillus spp,:Enterobacteriaceae ratio, underlining its potential to beneficially manipulate the intestinal microbial ecosystem. - Regression and direct methods do not give different estimates of digestible and metabolizable energy values of barley, sorghum, and wheat for pigs.
The comparison of direct and regression methods for determining the digestible energy (DE) and metabolizable energy (ME) values of barley, sorghum, and wheat for pigs suggest that regression and direct methods do not give different estimates of DE and ME for these cereals for pigs.
References
Foreing Agricultural Service. USDA. https://apps.fas.usda.gov/psdonline/app/index.html
FEDNA: http://www.fundacionfedna.org/
FND. CVB Feed Table 2016. http://www.cvbdiervoeding.nl
INRA. Sauvant D, Perez, J, y Tran G, 2004, Tables de composition et de valeur nutritive des matières premières destinées aux animaux d'élevage,
NRC 1982. United States-Canadian Tables of Feed Composition: Nutritional Data for United States and Canadian Feeds, Third Revision.
Rostagno, H,S, 2017, Tablas Brasileñas para aves y cerdos, Composición de Alimentos y Requerimientos Nutricionales, 4th Ed,
