

Introduction
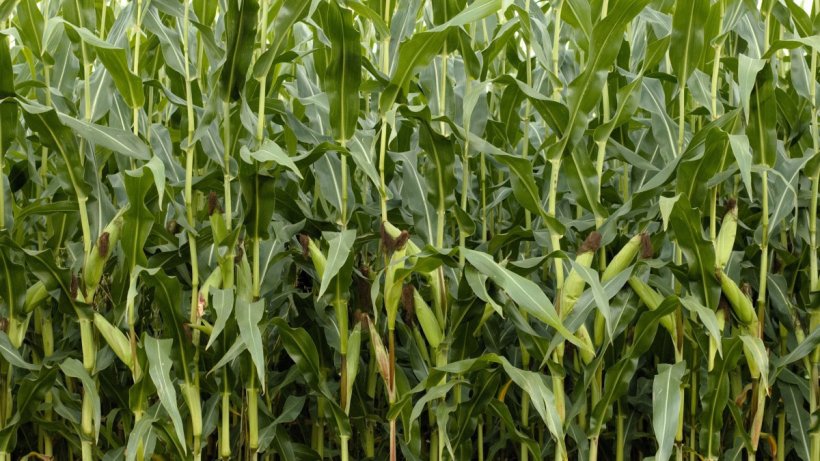
Maize (Zea mays) is a monocotyledonous herbaceous plant cultivated in summer that is included in the Gramineae family. It is currently grown globally, and it is the main cereal cultivated for animal nutrition, where it is mainly used as an energy source. The selection and improvement of its seeds have yielded several varieties with regard to climate, agronomic or applicability aspects. Dent corn is the variety most commonly used in animal nutrition, and other varieties (flint [hard], floury, sweet, pop and ornamental [pod]) are more used in human nutrition. Some varieties have been created because of their industrial applicability or for the improvement of their nutritional value (high lysine, high tryptophan, high oil content, high amylose, low phytic phosphorus) or to improve digestibility. The genetically modified varieties have been basically designed because of their disease resistance and their high productivity.

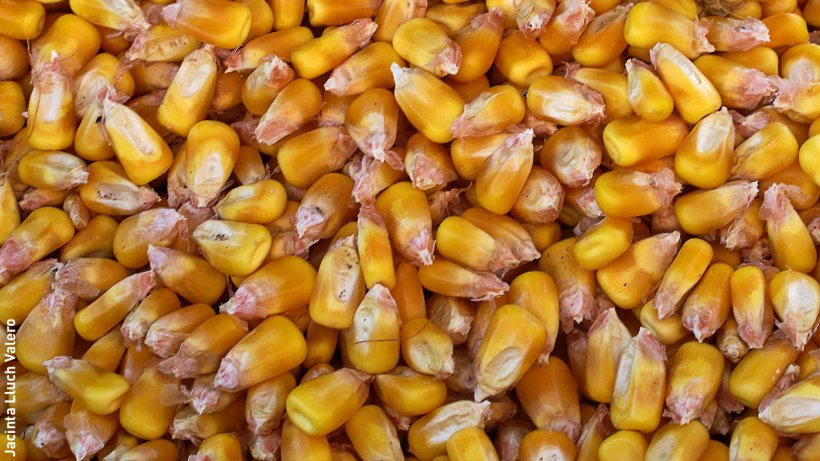
A corn grain consists, approximately of 6% of bran or pericarp, 11% of germ and 83% of endosperm. More than 50% of the endosperm is floury, this making maize one of the main energy sources in pig diets, because it has a high starch content (> 60%) together with a medium fat content of 3.5%. The other half of the endosperm is hard and consists of a protein tissue that surrounds the starch granules. It is a fraction that is richer in protein and that, together with the germ, provides a protein value of some 7.5%. Nevertheless, its low fibre content (2%), but higher in lipids (2%) and starch, make maize have a higher energy value (EM/kg) than the rest of the cereals. The average proportion of amylose and amylopectin is 25:75, but in waxy varieties the proportion of amylopectin almost reaches 100%, whilst in the amylomaize or '2' varieties it drops to 20%.
The presence of pentosans basically associated to the pericarp or bran (NDF content of some 8%) does not represent a negative impact on the viscosity of the digesta in piglets, and the impact is even less in adult pigs, as opposed to other cereals commonly used, such as wheat and barley. The corn grain is typically poor in lysine and it is unbalanced in terms of tryptophan; also, the high proportion of structural or reserve proteins (±94%) with respect to the total protein content, makes corn protein to have a low quality with respect to other typically high-energy cereals such as wheat. As in the case of other cereals typically used to feed pigs, maize is poor in minerals (basically Ca, Na and trace minerals) and vitamins. Lastly, the processing of corn can improve the digestibility of starch and the quality of the pellet: for instance, extrusion (alone or with a cereal mix) or flaked maize (cooked or not ) are the most common treatments when corn is used in piglet diets.
Production and trade
The charts show the global production and trade figures of maize.
Production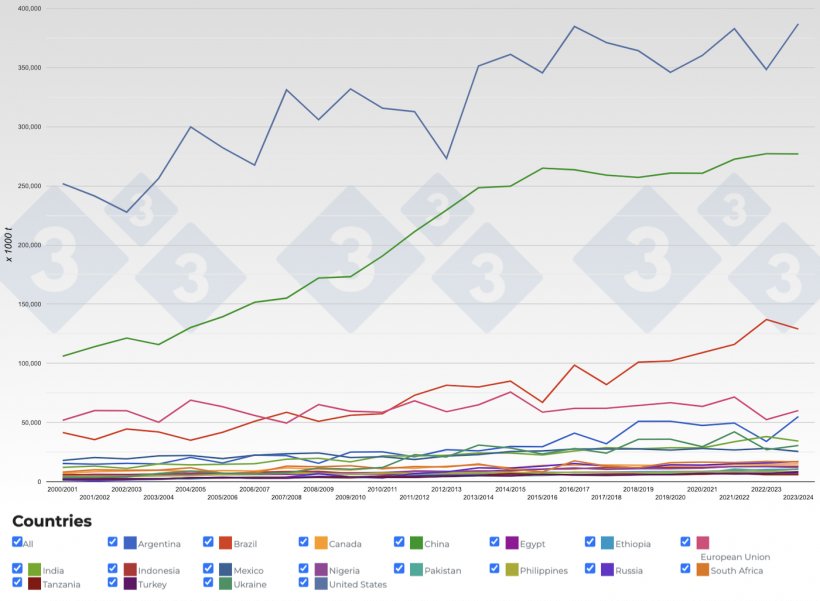
Trade


Comparative study of the nutritional values
The systems used in the comparison are: FEDNA (Spanish), CVB (Dutch), INRA (French), NRC (USA) and Brazil.
| FEDNA1 | CVB | INRA | NRC | Brazil | |
| DM (%) | 86.2-86.4 | 86.7 | 86.4 | 88.31 | 87.0-92.6 |
| Energy value (kcal/kg) | |||||
| Crude protein (%) | 7.3-8.1 | 7.6 | 8.1 | 8.24 | 6.92-8.8 |
| Ether extract (%) | 3.3-3.8 | 3.6 | 3.7 | 3.48 | 3.5-4.1 |
| Crude fibre (%) | 2.1-3 | 2.0 | 2.2 | 1.98 | 1.5-1.95 |
| Starch (%) | 62.0-63.8 | 62.0-64.9 | 64.1 | 62.55 | 60.6-66.1 |
| Sugars (%) | 1.6-1.7 | 1.3 | 1.6 | - | - |
| DE growth | 3,495-3,570 | - | 3,390 | 3,451 | 3,415-3,469 |
| ME growth | 3,435-3,505 | - | 3,310 | 3,395 | 3,330-3,390 |
| NE growth | 2,550-2,595 | 2,749 | 2,650 | 2,672 | 2,663-2,699 |
| NE sows | 2,580-2,620 | 2,749 | 2,730 | 2,672 | 2,692-2,784 |
| Protein value | |||||
| Crude protein digestibility (%) | 73-75 | 82 | 81 | - | 82.7 |
| Amino acid composition (% CP) | |||||
| Lys | 2.91-2.95 | 2.9 | 3.0 | 3.03 | 2.93 |
| Met | 2.03-2.07 | 2.1 | 2.1 | 2.18 | 2.04 |
| Met + Cys | 4.27-4.32 | 4.3 | 4.6 | 4.49 | 4.2 |
| Thr | 3.53-3.61 | 3.6 | 3.7 | 3.4 | 3.94 |
| Trp | 0.77-0.78 | 0.7 | 0.6 | 0.73 | 0.76 |
| Ile | 3.30-3.60 | 3.4 | 3.7 | 3.4 | 3.31 |
| Val | 4.70-4.75 | 4.8 | 5.00 | 4.61 | 4.58 |
| Arg | 4.43-4.50 | 4.7 | 4.7 | 4.49 | 4.71 |
| Standardised ileal digestibility (% CP) | |||||
| Lys | 76-77 | 75 | 80 | 74 | 78.9 |
| Met | 86-87 | 87 | 91 | 83 | 86.4 |
| Met + Cys | 84-85 | 84 | 90 | 81.5 | 88.1 |
| Thr | 82-83 | 79 | 83 | 77 | 78.8 |
| Trp | 79-80 | 76 | 80 | 80 | 75.7 |
| Ile | 86-87 | 86 | 88 | 82 | 89.9 |
| Val | 87 | 86 | 87 | 82 | 88.5 |
| Arg | 88 | 88 | 91 | 87 | 89.6 |
| Minerals (%) | |||||
| Ca | 0.02-0.03 | 0.01 | 0.04 | 0.02 | 0.02 |
| P | 0.25-0.27 | 0.24 | 0.26 | 0.26 | 0.29 |
| Phytic P | 0.19-0.20 | 0.21 | 0.195 | 0.21 | 0.15-0.21 |
| Available P | 0.05 | - | 0.03-0.08 | ||
| Digestible P | 0.05-0.06 | 0.0648 | 0.0728 | 0.0884 | 0.08-0.13 |
| Na | 0.01 | 0.00 | 0.004 | 0.02 | 0.01 |
| Cl | 0.05 | 0.05 | 0.05 | 0.05 | 0.09 |
| K | 0.29-0.35 | 0.34 | 0.32 | 0.32 | 0.32 |
| Mg | 0.1-0.12 | 0.08 | 0.1 | 0.12 | 0.1-0.11 |
1In the case of the FEDNA assessment system, we show the range of values (maximum and minimum) obtained from the integration of the 3 different classifications that this assessment system basically considers according to the protein, fat and starch content, that are parameters that basically differ because of the origin of the corn (Spanish corn, French corn and USA corn), this being a representation of the corn imports that complement the Spanish production).
2In the case of the BRAZIL assessment system, we show the range of values (minimum and maximum) obtained from the integration of the 3 different classifications that this assessment system basically considers according to the protein content (6.92%, 7.86% and 8.80%), that are basically subject to the different cultivation conditions within the same country.
Unlike the rest of the tables, BRAZIL and FEDNA clearly distinguish three maize qualities classified regarding their protein content (BRAZIL), and three origins (FEDNA) that are basically different in terms of protein, fat and starch; whilst the CVB, INRA and NRC only consider a single maize quality with intermediate values, CVB being the nearest to the FEDNA's Spanish maize (7.6%), and the NRC being in the upper range (8.24%), at a similar level to the values provided by the INRA, FEDNA for the French maize and FEDNA for the USA maize, with the exception of BRAZIL (11.5%), that includes maize varieties with the greatest protein percentage (8.80%). The moisture range proposed by the different assessment systems varies by >6%, with a minimum value in the case of the BRAZIL maize that has a greater protein content. Nevertheless, the FEDNA does not make a difference regarding the moisture level depending on the different origins, and it is similar to the moisture value proposed by the CVB and INRA, with the NRC showing the most similar value to that of the average value proposed by BRAZIL. If we do not consider the most extreme values for protein and starch proposed by BRAZIL, there is almost no relationship between the contents in dry matter, protein and starch, however when considererd is an influential value that drags the correlation as an artifact until reaching a value of r2 = 0.40. A clear positive correlation (r2 = 0.55) is seen between the protein and the starch content that could characterise the starch vitreousness degree, because it is known that the vitreous starch granules are harder because they are compacted by a matrix with a high protein content. Nevertheless, corn shows a marked negative correlation (r2 > 0,75) between dry matter and fibre content (increasing up to r2 = 0,87 if we consider the extreme value proposed by BRAZIL).
These relationships have a direct impact on the estimation of the net energy (NE) value. Although starch represents the greatest contribution in terms of energy, the slight variability present (4%) is not decisive to explain the difference of more than 200 kcal/kg NE seen between the most extreme assessment systems in terms of energy: 2749 kcal/kg; CVB vs. 2550 kcal/kg; FEDNA (national maize). We must bear in mind that there are negative (r2 = 0,55) and positive (r2 > 0.35) correlations for NE with respect to the fibre and fat content, that are more decisive than starch itself on the variation seen in the NE content. These correlations with NE are evident, except in the case of the CVB, that estimates a NE figure that is very high for the intermediate fibre and fat values, in comparison with the rest of the assessment systems in which this relationship is more direct, this showing a high energy valuation, mainly of fibre by the CVB.
We must underline that, unlike the rest of the assessment systems, BRAZIL and NRC give the highest dry matter (+4%), starch (+2.2%), protein (+8.4%), fat (+6.3%) and NE (+3%) values for maize, and a lower fibre content (-18.6%) than the average of the rest of the assessment systems (FEDNA, INRA and CVB). We must highlight that the evaluation of a same origin through different assessment systems gives place to very similar estimations (the case of INRA and FEDNA for French corn, or NRC andFEDNA for the USA corn, although there is a slight upward deviation for the NRC in terms of protein and starch, but a lower fibre content that may explain the diversion in terms of NE).
In terms of total amino acids, taking as a reference lysine and considering the same content in protein (7.5 ± 0.43%), we can basically see that BRAZIL and FEDNA (in all the categories regarding the origin and the protein contents), as well as the CVB, offer similar values for lysine (±2.93). Nevertheless, the NRC and INRA show higher values (3% of lysine). The values for the rest of the total amino acids are quite proportional with respect to lysine, except for threonine and the branched chain amino acids (valine and isoleucine), and they are the most variable between the different evaluation systems studied. The protein and lysine digestibility ratio shows a range of 74-80% with an average value of 77%, but this is basically attributable to the maximum value of 80% shown only by the INRA, with the NRC showing the lowest value.
Recent findings
1. Determination of the energy contents and nutrient digestibility of corn, waxy corn and steam-flaked corn fed to growing pigs.
Compared to normal corn, both the amylose and dietary fibre contents in waxy corn were lower, but the starch gelatinisation degree was greater. Moreover, the DE and ME contents, as well as the ATTD of NDF and ADF in waxy corn were greater than those in normal corn when fed to growing pigs. Furthermore, the steam-flaked corn had greater DE and ME contents, and ATTD of the ether extract (EE) and ADF compared to normal corn.
Therefore, both the variety and processing procedure have an influence on chemical compositions, energy contents and nutrient digestibility of corn, this affecting the energy content for growing pigs.
2. Effects of feeding corn-expressed phytase on the live performance, bone characteristics, and phosphorus digestibility of nursery pigs.
The efficacy of a corn-expressed phytase on the performance, bone characteristics, and P digestibility of nursery pigs fed a reduced P diet was studied. Six treatments were fed: positive control (PC; 0.4% or 0.32% aP for phase 2 or 3 and 4, respectively), negative control (NC; 0.15% reduction in aP), and 500, 1,000, 2,000, or 4,000 FTU of phytase per kg added to the NC in a 3-phase feeding program. Pigs fed ≥ 500 FTU of phytase per kg showed an improved growth, ATTD of P and bone ash when added to a reduced P diet, and 4,000 FTU of phytase per kg increased growth more than the PC treatment.
3. Effects of corn particle size on nutrient utilization in pigs evaluated under optimal and heat stress conditions.
The effects of corn particle size on nutrient digestibility and energy utilization in pigs were determined under optimal or heat stress conditions. Dietary treatments were as follows: 200-, 300-, 400-, 600-, 800-μm corn particle sizes obtained by mesh screens. Grinding corn to 200-μm particles had a positive effect on DM, CP, EE, and CF under optimal thermal conditions, while the 600-μm corn particle size had more positive effects on digestibility of CF, NDF, and ADF than a 200-μm corn particle size under heat stress.
4. In vitro digestibility of normal and waxy corn starch is modified by the addition of Tween 80.
Aqueous dispersions of normal and waxy corn starch (3% w/w) were mixed with Tween 80 (0, 7.5, 15, 22.5 and 30 g/100 g of starch), and gelatinised (90 °C, 20 min). Optical microscopy of the gelatinised starch dispersions (GSDx; x = Tween 80 concentration) revealed that the microstructure was characterized by a continuous phase of leached amylose and amylopectin entangled chains, and a dispersed phase of insoluble remnants, called ghosts, on whose surface small granules were observed, imputed to Tween 80. The apparent viscosity of the GSDx decreased as the concentration of Tween 80 increased (up to about 70-90%). The content of the rapidly digestible starch (RDS) and resistant starch (RS) fractions tended to increase significantly, at the expense of a significant decrease in the slowly digestible starch (SDS) fraction, an effect that may be attributed to the increase of amorphous structures and starch chain-surfactant complexes. The RDS and RS increase was more pronounced for normal than for waxy corn starch, and the significance of the increase was dependent on the Tween 80 concentration. Overall, the results showed that surfactant can greatly affect the digestibility of starch chains.
5. An increase in corn resistant starch decreases protein fermentation and modulates gut microbiota during in vitro cultivation of pig large intestinal inocula.
The increase in corn resistant starch content may attenuate protein fermentation. Fermentation patterns were analysed during a 24-h incubation of caecal and colonic digesta with varying corn resistant starch contents, using casein protein as the sole nitrogen source. The results showed that the concentration of short-chain fatty acids (SCFA) and cumulative gas production were increased, while ammonia-nitrogen (NH3-N) and branched-chain fatty acids (BCFA), which indicated protein fermentation, decreased when the corn resistant starch levels increased. Therefore the addition of corn resistant starch weakens the protein fermentation by influencing the microbial population and reducing protein fermentation in the caecum and colon in vitro.
References
Foreign Agricultural Service. USDA. https://apps.fas.usda.gov/psdonline/app/index.html
FEDNA: http://www.fundacionfedna.org/
FND. CVB Feed Table 2016. http://www.cvbdiervoeding.nl
INRA. Sauvant, D.; Perez, J. and Tran, G. (2004): Tables de composition et de valeur nutritive des matières premières destinées aux animaux d'élevage.
NRC (1982): United States-Canadian Tables of Feed Composition: Nutritional Data for United States and Canadian Feeds, Third Revision.
Rostagno, H.S. (2017): Brazilian tables for fowl and swine. Composition of feed and nutritional requirements, 4th ed.
