Introduction
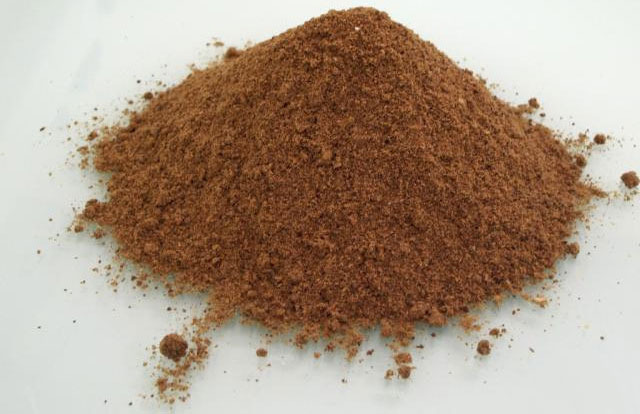
Fish meal is a co-product of animal origin and is a source of high-quality protein for animal feed. Currently, fish meal is manufactured from species that are caught secondarily in commercial fishing and not used for human consumption, or from the fractions from the fish catching and canning industry.

During processing, three main fractions are separated: solids (dry matter without fat), oil, and water. Fish meal is obtained through a process that involves cooking, pressing, drying, and milling. After cooking (usually at >90ºC) pressing is done, where the leachates are eliminated and a "presscake" is obtained. The liquids are decanted, the supernatants are centrifuged to obtain the fish solubles, which are concentrated by gentle evaporation which can be marketed as a separate product or be incorporated back into the paste). If they are reincorporated, the presscake and the solubles are mixed before the drying process to obtain fish meal with a maximum final humidity of 10%.
Processing raw fish at low temperatures (<70ºC) produces high quality products (because the Maillard reaction does not occur and it offers a better availability of amino acids) and is generally not associated with the fishing and canning industry but rather with processing fish with the express purpose of obtaining fish meal. However, in order to prevent proteins and oils from decomposing, raw fish is often refrigerated (by cold water systems or by mixing ice with the fish) or is chemically preserved (with sodium nitrite or formaldehyde).
Therefore, the nutritional composition and quality of fish meal is directly related to the type of fish used, its freshness, storage, and thermal processing. In this sense, fish meal made from oily fish has a higher protein and fat content (>70% and 9%, respectively) and a lower ash content (<15%) than fish meal made from whitefish. In terms of quality, the storage has a direct impact on the generation of degradation compounds that can alter its acceptability and palatability to pigs.
Indirectly, fish meal is a good source of minerals, especially Ca and phosphorus which are very available, but also essential microminerals (Se, Zn, Cu, Fe and Zn).
Comparative study of nutritional values
Systems used in the comparison are: FEDNA (Spain), CVB (the Netherlands), INRA (France), NRC (United States) and Brasil (Brazil).
| FEDNA1 | CVB1 | INRA2 | NRC3 | BRASIL4 | |
|---|---|---|---|---|---|
| DM (%) | 92.0-93.0 | 91.1-91.7 | 94.3-92.0 | 93.7 | 91.7-92.0 |
| Energy value (kcal/kg) | |||||
| Crude protein (%) | 59.0-70.0 | 56.3-70.7 | 62.6-69.9 | 63.3 | 54.6-63.8 |
| Ether extract (%) | 9.0-9.5 | 14.2-10.1 | 8.9-9.3 | 9.7 | 8.1-5.9 |
| Crude fiber (%) | 1.0-0.4 | 0.0 | 0.0 | 0.2 | 0.7-0.0 |
| Starch (%) | 0.0 | 0.0 | 0.0 | 0.0 | 0.0 |
| Sugars (%) | 0.0 | 0.0 | 0.0 | - | - |
| DE growing pigs | 3540-4230 | - | 3720-4070 | 3958 | 3050-3170 |
| ME growing pigs | 3090-3590 | - | 3370-3680 | 3528 | 2740-2845 |
| NE growing pigs | 1965-2770 | 2513-2464 | 2190-2370 | 2351 | 1733-1726 |
| NE sows | 1965-2270 | 2513-2464 | 2180-2360 | 2351 | 1733-1736 |
| Protein value | |||||
| Digestibility of crude protein (%) | 86-89 | 85 | 85 | 85 | 79-87.6 |
| Composition of amino acids (% CP) | |||||
| Lys | 7.05-7.50 | 7.6 | 7.40-7.50 | 7.21 | 6.10-6.77 |
| Met | 2.50-2.80 | 2.8 | 2.60-2.80 | 2.73 | 2.36-2.51 |
| Met + Cys | 3.30-3.70 | 3.7 | 3.40-3.70 | 3.70 | 4.12-3.39 |
| Thr | 4.10-4.10 | 4.2 | 4.10-4.20 | 4.10 | 4.03-4.04 |
| Trp | 0.95-1.05 | 1.1 | 1.00 | 1.00 | 0.81-0.96 |
| Ile | 4,10-4-10 | 4.2 | 4.00-4.30 | 4.05 | 3.81-3.79 |
| Val | 4.75-4.90 | 4.9 | 4.80-5.10 | 4.84 | 4.74-4.70 |
| Arg | 6.05-5.90 | 5.9 | 6.10-5.80 | 6.07 | 5.95-6.10 |
| Standardized ileal digestibility (% CP) | |||||
| Lys | 89-91 | 89-90 | 90-92 | 86 | 77.1-88.1 |
| Met | 88-90 | 89-91 | 91-93 | 87 | 74.3-87.2 |
| Met + Cys | 86-88 | 81.5 | 89-91 | 75.5 | 64.4-84.6 |
| Thr | 88-88 | 88-86 | 86-89 | 81 | 67.6-84.9 |
| Trp | 86-87 | 86-89 | 89-91 | 76 | 73.5-84.4 |
| Ile | 90-91 | 90-89 | 89-91 | 83 | 76.5-88.2 |
| Val | 89-90 | 89-88 | 88-90 | 83 | 70.1-85.9 |
| Arg | 90-91 | 92-94 | 94-95 | 86 | 83.1-88.5 |
| Minerals (%) | |||||
| Ca | 5.30-2.55 | 4.01-2.70 | 5.54-2.41 | 4.28 | 5.75-4.70 |
| P | 3.00-2.00 | 2.64-2.19 | 3.10-2.06 | 2.93 | 2.99-2.41 |
| Phytate P | 0.00 | 0.00 | 0.00 | 0.0 | 0.00 |
| Available P | 3.00-2.00 | - | - | - | 2.99-2.41 |
| Digestible P | 2.40-1.60 | 2.03-1.69 | 2.39-1.59 | 2.40 | 2.41-1.94 |
| Na | 0.84-0.90 | 1.05 | 1.12-0.95 | - | 0.86-0.50 |
| Cl | 1.50-1.55 | 1.52-1.53 | 1.63-1.51 | - | 0.9-na |
| K | 0.85-1.18 | 0.64-1.40 | 0.74-1.22 | 0.62 | 0.68-0.58 |
| Mg | 0.2 | 0.23 | 0.26-0.19 | 0.13 | 0.16-na |
1For the FEDNA and CVB evaluation systems the range of values (minimum and maximum) is derived from integrating the four different classifications that this evaluation system considers, mainly depending on the protein content (59%, 62-64%, 65-67% and 70%, respectively), which differ basically by the type of fish used and the production process (high (>90ºC) or low (<70ºC) temperature).
2For the INRA evaluation system, the range of values (minimum and maximum) is given, derived from integrating the three classifications that this valuation system considers according to crude protein level (62%, 65% and 70%) following the same concept as FEDNA and CVB.
3For the NRC evaluation system only the average value is given since the American evaluation system assumes that no distinction between qualities can be made and everything is combined into what is considered a single quality, as an average value (64% protein).
4 For the BRASIL evaluation system the range of values (minimum and maximum) is given, derived from integrating the 2 classifications that this evaluation system considers according to crude protein level (54% and 61%), mainly explained by the quality of the fish used.
Unlike other protein ingredients, a wide variety of qualities and categories is considered by most of the selected evaluation systems, revealing high variability due to the origin and quality of the raw material (oily, white, or mixed fish), the storage (fresh and raw or from canning industry processes) and the production process for obtaining the meal (temperature, extraction, soluble content). For BRASIL, although it differentiates between two qualities by maximum protein content and production area, everything indicates that the meal is obtained from white fish. Finally, NRC refrains from assuming a differentiation by qualities, arguing that it is difficult to characterize and prevent the mixing and variability between batches, so it only considers an average value as a single product or category. Overall, the average value of protein between the different selected evaluation systems is 63.8%±4.7, showing high variability, which is what justifies the differentiation between qualities in the selected evaluation systems, with the exception of NRC.
It has been stated that the quality and concentration of the protein is directly related to the type of fish used (higher protein for oily fish); but this also directly implies a higher fat content. This positive relationship is clear with FEDNA (r2 >0.95) and INRA (r2 >0.85) however with CVB this relationship is inversely proportional (r2 =-0.94), indicating that the processing of the fish and the oil extraction more greatly affect the fat value than does the type of fish used (assuming the higher the protein concentration the lower the fat content). BRASIL, although it has only two categories, also exhibits the same trend as CVB, but has a more logical explanation, both for protein and fat content, due to the type of fish used in the production and consumption area (white fish). Lastly, NRC remains in a middle range for protein and fat content (63.3% and 9.7%, respectively), which clearly reflects the decision to present a single average value.
The range for dry matter is very consistent across all evaluation systems, showing very little variation between them (92.2%±0.8).
The variation and response observed with the protein content in relation to the production process and the origin of the fish is similarly seen with the amino acid content (using lysine as reference for the rest of the AAs), for all the selected evaluation systems except CVB, which gives one lysine value for all the meal qualities considered. (CVB gives only one value for the other amino acids as well.) At 7.6%, CVB's lysine value is even higher than the 7.5% that FEDNA and INRA give for fish meal with 70% protein. For the rest of the amino acids, CVB presents average values between 5 and 8 percentage points higher than FEDNA, INRA, and NRC. BRAZIL, according to the protein and amino acid levels considered, gives lower values for most of the AAs, between 8 and 10 percentage points less, with the most extreme difference in value compared to CVB being tryptophan (20 percentage points less).
The digestibility coefficient for protein and lysine ranges from 85-89% and 82.6-90.6% , respectively. As seen with the amino acid content, an overestimation of the digestibility coefficient is given by FEDNA and INRA (+1% and +2%, respectively, with an extreme of +7% and +10% specifically for the sulfur-containing AAs) and an underestimation is given by BRAZIL and NRC in comparison to BVC (-10% and -8%).
Because of its nature, fish meal is a protein source that carries with it a high fat content. We can observe a greater impact of the fat content on the estimation of the energy value (r2 = 0,.47) since the influence of the protein content does not allow for explanation of any effect on the prediction of the energy value (R2 < 0.20). This response is clearly seen in the estimation of the NE value where it can be seen that while FEDNA and INRA present an increase in NE value associated with the level of protein and fat (NE + 805kcal/kg and + 180kcal/kg inferior), CVB shows a reduction of 49 kcal/kg. BRASIL in the lower protein range, but with the same inverse trend with the fat content, also presents a reduction in the estimated NE but to a lesser extent (<10kcal/kg). The trend for arginine is the opposite, although minimal (1%); the average value given by CVB is less than that the rest of the systems studied.
The type and the quality of fish used has a very strong impact on the end mineral content of the product (ranging from 2.5%-5.7% Ca and 2%-3.1% P); the lowest values being for the higher protein ranges for FEDNA, CVB, and IRNA, with the highest values given by BRASIL (ranging from 4.7%-5.7% Ca and 2.4%-3% P) due to the kind of fish and protein level considered; or NRC may consider higher values because it presents the average values (4.3% Ca and 2.9% P). It is important to note that digestible P values are very similar between evaluation systems ranging from 1.6-2.5% with virtually identical ranges for FEDNA and INRA, and a less variable range for CVB for similar protein ranges.
Recent findings
1. Torula yeast has greater digestibility of amino acids and phosphorus, but not energy, compared with a commercial source of fish meal fed to weanling pigs.
This research was conducted to test the hypothesis that the standardized ileal digestibility (SID) of AA, concentrations of DE and ME, and the standardized total tract digestibility (STTD) of P in a source of torula yeast are not different from values obtained in Menhaden fish meal. The study concluded that the SID of AA and the STTD of P in torula yeast is greater than in fish meal, but values for the concentration of DE and ME in torula yeast are not different from those in fish meal.
2. Effects of different protein sources completely replacing fish meal in low-protein diet on growth performance, intestinal digestive physiology, and nitrogen digestion and metabolism in nursery pigs.
The study compared the effects of selected proteins replacing fish meal in low-protein diets on piglets' growth performance, intestinal digestive physiology, and nitrogen digestion and metabolism. Five reduced CP, amino acid-supplemented diets containing 4% of either S50, HP300, concentrated degossypolized cottonseed protein (CDCP), P50, or fish meal were compared. Compared with fish meal, dietary proteins did not affect growth performance, apparent total tract digestibility, serum hormone levels, apparent ileal digestibility (AID) of CP and most AA, duodenal and ileal morphology, digestive enzyme activity, or pH in small intestine of piglets. However, HP300, CDCP, and P50 decreased fecal N excretion per weight gain. AID of Ile in S50 and HP300 and Glu in P50 were improved, and AID of Gly in other proteins was reduced. S50 and P50 lowered the contents of colonic isobutyric and isovaleric. S50 and HP300 reduced jejunal villus height. CDCP increased the pepsin activity in the stomach. S50, HP300, and CDCP decreased pH in the proximal colon. Overall, the selected proteins could completely replace fish meal in low-protein diet without impairing piglets' growth via maintaining intestinal digestive physiology, and nitrogen digestion and metabolism.
3. Partial replacement of soybean meal with different protein sources in piglet feed during the nursery phase.
This study evaluated the partial replacement of soybean meal with different protein sources including fish meal in piglet diets during the nursery phase in terms of digestibility, nitrogen balance, growth performance and blood parameters. It was reported that the use of feed with SBM as the only protein source influences larger total nitrogen excretion, promotes a reduction in the growth performance of piglets, and increases plasma urea levels in the pre-starter phase as compared to diets with fishmeal and soy protein concentrate.
4. Effect of replacing marine fish meal with catfish (Pangasius hypophthalmus) by-product protein hydrolyzate on the growth performance and diarrhoea incidence in weaned piglets.
The present study was conducted to evaluate the effect of the kind of fish used to replace fish meal on piglet performance and intestinal health (common FM vs catfish CPH meal). The study concluded that it is possible and suitable to replace up to 100% of the FM by CPH in diets for weaning and growing pigs, resulting in improved ADG and FCR, lower feed cost/gain as well as reduced diarrhoea incidence and improved faecal score.
5. Apparent ileal digestibility of nutrients and amino acids in soybean meal, fish meal, spray-dried plasma protein and fermented soybean meal to weaned pigs.
This study sought to determine whether fermentation could increase apparent ileal digestibility of dry matter, nitrogen, energy and amino acids (AA) in fermented soybean meal greater than that of soybean meal (SBM), fish meal and spray-dried plasma protein. It was reported that the fermentation process improved the nutritional quality of SBM, due to ANF reduction, leading to improvement of digestibility of AA similar to fish meal and spray-dried plasma protein. Therefore it is suitable to be used as a specialized feed ingredient for young animal diets in an attempt to reduce diet costs.
References
FEDNA: http://www.fundacionfedna.org/
FND. CVB Feed Table 2016. http://www.cvbdiervoeding.nl
INRA. Sauvant D, Perez, J, y Tran G, 2004, Tables de composition et de valeur nutritive des matières premières destinées aux animaux d'élevage.
NRC 1982. United States-Canadian Tables of Feed Composition: Nutritional Data for United States and Canadian Feeds, Third Revision.
Rostagno, H,S, 2017, Tablas Brasileñas para aves y cerdos, Composición de Alimentos y Requerimientos Nutricionales, 4° Ed.